Skip to main content
Statistics for Business
My Course
Learn
Exam Prep
AI Tutor
Study Guides
Flashcards
Explore
Try the app
My Course
Learn
Exam Prep
AI Tutor
Study Guides
Flashcards
Explore
Try the app
Back
Regression Readout of the Data Analysis Toolpak - Excel quiz
You can tap to flip the card.
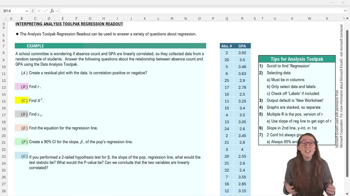
What is the purpose of using Excel's Data Analysis Toolpak for regression analysis?
You can tap to flip the card.
👆
What is the purpose of using Excel's Data Analysis Toolpak for regression analysis?
It allows you to quickly and efficiently perform linear regression and interpret relationships between variables.
Track progress
Control buttons has been changed to "navigation" mode.
1/15
Related flashcards
Related practice
Recommended videos
Regression Readout of the Data Analysis Toolpak - Excel definitions
Regression Readout of the Data Analysis Toolpak - Excel
15 Terms
Prediction Intervals
12. Regression
10 problems
Topic
Ernest
12. Regression
4 topics
15 problems
Chapter
Ally
Guided course
09:50
Regression Readout of the Data Analysis Toolpak - Excel
58
views
Terms in this set (15)
Hide definitions
What is the purpose of using Excel's Data Analysis Toolpak for regression analysis?
It allows you to quickly and efficiently perform linear regression and interpret relationships between variables.
Which menu option do you select in Excel to access the Data Analysis Toolpak?
You select 'Data' and then click the 'Data Analysis' button on the far right.
What must you do when selecting your y and x data ranges for regression in Excel?
You must select the data vertically in columns, include labels if desired, and avoid any blank cells.
What should you check off if you include labels in your data selection for regression?
You should check off the 'Labels' option in the regression setup menu.
How do you specify a confidence interval other than the default 95% in the regression readout?
You manually enter your desired confidence level, such as 90%, in the regression setup menu.
What is the default output location for the regression readout in Excel?
The default is a new worksheet, which helps keep results organized.
What visual plots can you generate from the regression readout to assess model fit?
You can generate residual plots and line fit plots.
What does a residual plot with scattered points near zero indicate about the model fit?
It suggests that the linear model is a good fit for the data.
How is the direction of correlation between absence count and GPA shown in the line fit plot?
The plot shows that as absence count increases, GPA decreases, indicating negative linear correlation.
Where do you find the correlation coefficient (r) in the regression readout, and what must you do if the correlation is negative?
You find it in the 'Multiple R' row, and you must manually add a negative sign if the correlation is negative.
What does the coefficient of determination (R²) represent in regression analysis?
It represents the percentage of variation in the y variable explained by variation in the x variable.
What is the regression equation for GPA as a function of absence count from the readout?
The equation is y = -0.05x + 3.76, where y is GPA and x is absence count.
How do you find the 90% confidence interval for the slope in the regression readout?
You look at the 'Lower 90%' and 'Upper 90%' columns in the row for the x variable (absence count).
What is the interpretation of a p-value much smaller than standard alpha values in hypothesis testing for regression?
It means you reject the null hypothesis and conclude there is significant linear correlation between the variables.
What is the null hypothesis when testing the slope (beta) in regression analysis?
The null hypothesis is that there is no linear correlation between the two variables.
 BackBack

 09:50
09:50