Skip to main content
Statistics for Business
My Course
Learn
Exam Prep
AI Tutor
Study Guides
Flashcards
Explore
Try the app
My Course
Learn
Exam Prep
AI Tutor
Study Guides
Flashcards
Explore
Try the app
Back
Sampling Distribution of the Sample Mean and Central Limit Theorem definitions
You can tap to flip the card.
Population Mean
You can tap to flip the card.
👆
Population Mean
The average value for an entire group, often unknown and estimated using sample data.
Track progress
Control buttons has been changed to "navigation" mode.
1/15
Related flashcards
Related practice
Recommended videos
Sampling Distribution of the Sample Mean and Central Limit Theorem quiz
Sampling Distribution of the Sample Mean and Central Limit Theorem
15 Terms
Sampling Distribution of the Sample Mean and Central Limit Theorem
7. Sampling Distributions & Confidence Intervals: Mean
10 problems
Topic
David-Paige
7. Sampling Distributions & Confidence Intervals: Mean
3 topics
15 problems
Chapter
Ally
Guided course
02:33
Central Limit Theorem Example 1
396
views
16
rank
Guided course
05:14
Central Limit Theorem
457
views
3
rank
Guided course
06:53
Sampling Distribution of Sample Mean
757
views
16
rank
Terms in this set (15)
Hide definitions
Population Mean
The average value for an entire group, often unknown and estimated using sample data.
Sample Mean
The average value calculated from a subset of the population, used to estimate the population average.
Random Sample
A subset of individuals chosen from a population where each member has an equal chance of selection.
Sampling Error
The difference between a sample statistic and the actual population parameter due to random chance.
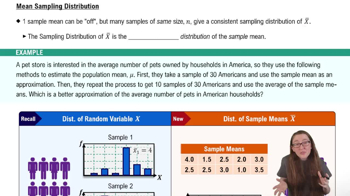
Sampling Distribution
The probability distribution of a statistic, such as the sample mean, from repeated samples of the same size.
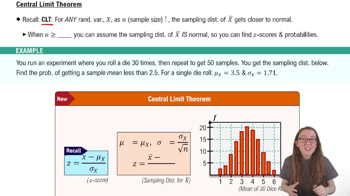
Central Limit Theorem
A principle stating that the sampling distribution of the sample mean approaches normality as sample size increases.
Normal Distribution
A symmetric, bell-shaped curve describing the spread of a variable where most values cluster around the mean.
Z-Score
A standardized value indicating how many standard deviations a statistic is from the mean of its distribution.
Population Standard Deviation
A measure of variability for an entire group, reflecting how much individual values differ from the mean.
Sample Size
The number of observations or data points included in a single sample from the population.
Histogram
A graphical representation showing the frequency distribution of a set of data, often used for visualizing distributions.
Right Skew
A distribution shape where most values are concentrated on the left, with a long tail extending to the right.
Probability
A numerical measure of the likelihood that a specific event or outcome will occur.
Statistic
A numerical value calculated from sample data, used to estimate a population parameter.
Parameter
A numerical value summarizing a characteristic of an entire population, such as its mean or standard deviation.
 BackBack

 02:33
02:33