Skip to main content
Statistics for Business
My Course
Learn
Exam Prep
AI Tutor
Study Guides
Flashcards
Explore
Try the app
My Course
Learn
Exam Prep
AI Tutor
Study Guides
Flashcards
Explore
Try the app
Back
Two Means - Unknown Variances Hypothesis Test - Excel quiz
You can tap to flip the card.
What is the null hypothesis when performing a hypothesis test for two population means?
You can tap to flip the card.
👆
What is the null hypothesis when performing a hypothesis test for two population means?
The null hypothesis is that the two means are equal (μ₁ = μ₂).
Track progress
Control buttons has been changed to "navigation" mode.
1/15
Related flashcards
Related practice
Recommended videos
Two Means - Unknown Variances Hypothesis Test - Excel definitions
Two Means - Unknown Variances Hypothesis Test - Excel
15 Terms
10. Hypothesis Testing for Two Samples
3 topics
15 problems
Chapter
Ally
Guided course
04:43
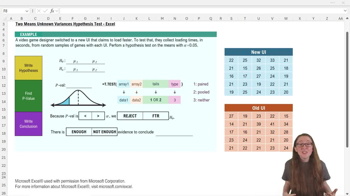
Two Means - Unknown Variances Hypthesis Test - Excel
70
views
1
rank
Guided course
03:50
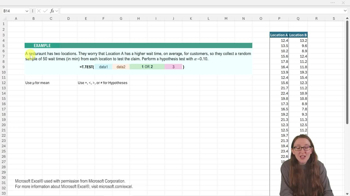
Two Means - Unknown Variances Hypthesis Test - Excel Example 2
48
views
Guided course
04:08
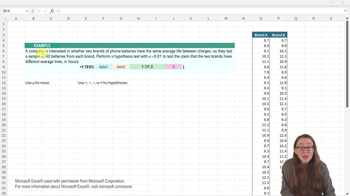
Two Means - Unknown Variances Hypthesis Test - Excel Example 1
53
views
Terms in this set (15)
Hide definitions
What is the null hypothesis when performing a hypothesis test for two population means?
The null hypothesis is that the two means are equal (μ₁ = μ₂).
In the video game UI example, what does μ₁ represent?
μ₁ represents the average loading time for the new UI.
What does the alternative hypothesis claim in the UI loading time example?
The alternative hypothesis claims that the new UI loads faster, so μ₁ < μ₂.
Which Excel function is used to find the p-value for a two means t-test?
The function used is =T.TEST(array1, array2, tails, type).
What does the 'array1' input in the T.TEST function refer to?
It refers to the first data set, which is the new UI data in the example.
What value should you enter for 'tails' in the T.TEST function for a one-tailed test?
You should enter 1 for a one-tailed test.
What does entering a '3' for the 'type' input in T.TEST indicate?
Entering 3 tells Excel to perform a regular two-sample t-test (not paired or pooled).
If your alternative hypothesis uses a less than symbol, which tail test do you perform?
You perform a left-tailed test, which is a one-tailed test.
How do you decide whether to reject the null hypothesis using the p-value and alpha?
If the p-value is less than alpha, you reject the null hypothesis; otherwise, you fail to reject it.
In the example, what was the calculated p-value and what was the alpha level?
The p-value was about 0.22 and the alpha level was 0.05.
What conclusion do you draw if the p-value is greater than alpha?
You fail to reject the null hypothesis.
What does failing to reject the null hypothesis mean in the context of the UI loading times?
It means there is not enough evidence to conclude that the new UI loads faster than the old UI.
What is the benefit of using Excel's T.TEST function for hypothesis testing?
It allows you to find the p-value directly from your data in one step, making the process quicker and easier.
What does the 'array2' input in the T.TEST function refer to?
It refers to the second data set, which is the old UI data in the example.
Why is it important to match the tails input in T.TEST to your alternative hypothesis?
Because it ensures you get the correct p-value for the direction of your test (left, right, or two-tailed).
 BackBack
 04:43
04:43