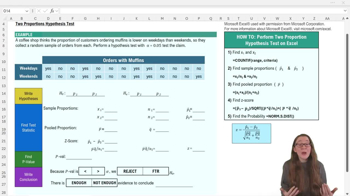
What is the null hypothesis (H0) when testing two population proportions?
The null hypothesis is that the two proportions are equal, or H0: p1 = p2.
How do you define the alternative hypothesis (Ha) if you suspect the first proportion is less than the second?
The alternative hypothesis is Ha: p1 < p2.
What Excel function can you use to count the number of 'yes' responses in a data range?
You can use the COUNTIF function, e.g., =COUNTIF(range, "yes").
How do you calculate the sample proportion (p̂) in Excel?
Divide the number of successes (x) by the sample size (n), e.g., =x/n.
What is the formula for the pooled proportion (p̄) in a two-proportion z-test?
The pooled proportion is (x1 + x2) / (n1 + n2).
How do you calculate q̄ (the complement of the pooled proportion) in Excel?
Subtract the pooled proportion from 1, e.g., =1 - p̄.
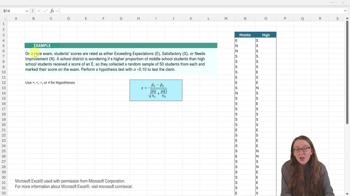
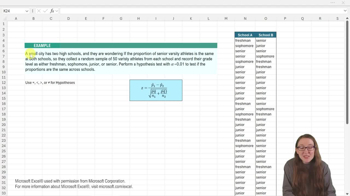
What is the numerator in the z-score formula for two proportions?
The numerator is the difference between the sample proportions: p̂1 - p̂2.
How do you calculate the denominator of the z-score formula for two proportions?
Take the square root of [p̄ × q̄ × (1/n1 + 1/n2)].
Which Excel function converts a z-score to a left-tail p-value?
Use =NORM.S.DIST(z, TRUE) to get the cumulative left-tail probability.
What does it mean if your p-value is greater than your alpha level (e.g., 0.05)?
It means you fail to reject the null hypothesis; there is not enough evidence for the alternative.
If both sample sizes (n1 and n2) are equal, how does this affect the denominator in the z-score formula?
The terms p̄ × q̄ / n1 and p̄ × q̄ / n2 will be equal, simplifying the calculation.
What is the conclusion if you fail to reject the null hypothesis in a two-proportion test?
There is not enough evidence to support the claim that the proportions are different as stated in Ha.
Why is it helpful to break down the z-score formula into parts when using Excel?
It reduces the chance of errors and makes the calculation easier to follow.
What is the significance level (alpha) commonly used in hypothesis testing?
A common alpha level is 0.05, representing a 5% risk of Type I error.
What does the p-value represent in the context of a two-proportion hypothesis test?
The p-value is the probability of observing a test statistic as extreme as, or more extreme than, the one calculated, assuming the null hypothesis is true.
 Back
Back
 09:31
09:31