 Back
BackChapter 1: Data and Decisions – Business Statistics Study Notes
Study Guide - Smart Notes
 Tailored notes based on your materials, expanded with key definitions, examples, and context.
Data and Decisions
Introduction to Data in Business Context
Data is the foundation of business decision-making. Every transaction, interaction, and activity generates data, which is stored in digital repositories called data warehouses. The modern business environment relies heavily on data to inform decisions across all areas, from inventory management to marketing strategies. However, data alone is not sufficient; it must be analyzed and interpreted within the context of specific business questions.
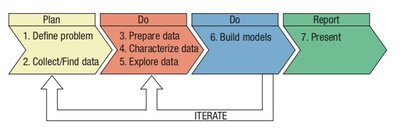
The 7-Step Plan, Do, and Report Strategy
To turn raw data into actionable information, a structured approach is essential. The 7-step Plan, Do, and Report strategy guides the process from problem definition to communication of results.
Plan:
Define the problem.
Collect and/or find data and identify the variables.
Do:
Prepare and wrangle data.
Characterize the data.
Explore the data (summarize and visualize).
Model (if appropriate): Check conditions and assumptions, fit the model, and make calculations.
Report:
Communicate and present findings.
The Role of Data in Decision Making
Business Analytics and Data Mining
Businesses use data mining to extract actionable information from large datasets, often collected during routine operations. Predictive analytics focuses on forecasting future performance, while business analytics encompasses all uses of data and statistical analysis to inform decisions.
The Five W's of Data Context
Understanding data requires knowing its context, summarized by the Five W's:
Who: The cases or subjects about whom data is collected.
What: The variables measured.
When: The time data was collected.
Where: The location of data collection.
Why: The purpose of data collection.
How: The method of data collection (often added).
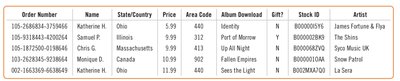
Data is often organized in tables, where rows represent cases and columns represent variables.

Cases and Variables
Definitions and Examples
Cases are the subjects or objects about which data is collected. These can be respondents (survey participants), subjects (experiment participants), or experimental units (animals, plants, websites, etc.). Variables are the characteristics recorded about each case, typically shown as columns in a data table.

Types of Variables
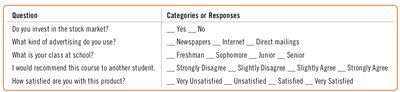
Categorical vs. Quantitative Variables
Variables are classified based on the type of information they provide:
Categorical (Qualitative) Variables: Name categories and answer questions about how cases fall into those categories. Examples include "yes/no" responses, zip codes, or types of advertising used.
Quantitative Variables: Have measured numerical values with units, indicating the quantity of what is measured. Examples include price, age (in years), or spending amounts.
Variable Classification Examples
Account ID – categorical (nominal, identifier)
Pre Spending – quantitative (units $)
Post Spending – quantitative (units $)
Age – categorical (ordinal), could be quantitative if measured precisely
Segment – categorical (nominal)
Enroll? – categorical (nominal)
Offer – categorical (nominal)
Segment Spend – quantitative (units $)
Data can be cross-sectional (measured at one point in time) or time series (measured at regular intervals over time).
Identifier Variables
Identifier variables are unique identifiers assigned to each individual or item, such as social security numbers or transaction IDs. They do not have units and are a special kind of categorical variable, useful for combining data and avoiding duplication, but not for analysis.
Nominal and Ordinal Variables
Categorical variables used only to name categories without order are nominal variables. When data values can be ordered, the variable has ordinal values (e.g., employee rank by months employed).
Cross-Sectional and Time Series Data
Definitions
Time Series Data: Variables measured at regular intervals over time (e.g., monthly sales).
Cross-Sectional Data: Several variables measured at the same time point (e.g., sales revenue, customer count, and expenses for all stores in one month).
Data Sources: Where, How, and When
Importance of Context
Where, how, and when data are collected can significantly affect its meaning and usefulness. Data collected in different locations or at different times may not be comparable. The method of collection determines whether the data is representative and reliable.
Best Practices and Common Pitfalls
Critical Thinking in Data Analysis
Always consider the context and source of data.
Do not assume a variable is quantitative just because its values are numbers; numerical labels can represent categories.
Be skeptical of data interpretations; context can be manipulated to influence conclusions.
Identify the Five W's before analyzing data.
Understand whether variables are categorical or quantitative based on the analysis goal.
Summary Table: Variable Types and Examples
Variable | Type | Example |
|---|---|---|
Account ID | Identifier (Categorical, Nominal) | 12345, 67890 |
Pre Spending | Quantitative | $100, $200 |
Age | Ordinal/Categorical or Quantitative | Child, Teen, Adult; 25 years |
Segment | Categorical (Nominal) | Gold, Silver, Bronze |
Enroll? | Categorical (Nominal) | Yes, No |
Segment Spend | Quantitative | $500, $750 |
Key Formulas and Concepts
Data Table Structure
Data tables are structured as follows:
Rows: Cases (subjects, respondents, units)
Columns: Variables (characteristics measured)
General Equation for Data Analysis
While Chapter 1 does not introduce specific statistical formulas, it sets the foundation for later analysis:
Where data is processed and analyzed to produce information, which then informs business decisions.
Conclusion
Understanding the context, types, and sources of data is essential for effective business decision-making. Always identify the Five W's, classify variables appropriately, and be critical of the data's origin and purpose. This foundational knowledge prepares students for deeper statistical analysis in subsequent chapters.
