 Back
BackChapter 7: Introduction to Sampling Distributions – Business Statistics Study Notes
Study Guide - Smart Notes
 Tailored notes based on your materials, expanded with key definitions, examples, and context.
Introduction to Sampling Distributions
Overview
Sampling distributions are fundamental in business statistics, providing a framework for understanding how sample statistics relate to population parameters. This chapter explores sampling error, the sampling distribution of the mean, and the sampling distribution of proportions, with practical business applications and key statistical theorems.
Sampling Error: What It Is and Why It Happens
Definition and Causes
Sampling error occurs whenever a sample is used to estimate a population parameter. Even with random sampling, the sample may not perfectly represent the population, resulting in differences between sample statistics and population parameters.
Sampling Error: The difference between a statistic (computed from a sample) and a parameter (computed from the population).
Parameter: A measure computed from the entire population; its value remains constant unless the population changes.
Simple Random Sample: A sample in which every possible sample of a given size has an equal chance of being selected.
Business Application: Hummel Development Corporation
Consider a company with 12 office complexes, each with a known square footage. The entire set of projects forms the population.
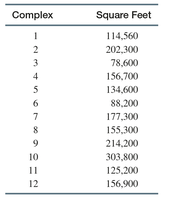
The population mean (parameter) is 158,972 square feet.
A random sample of 5 projects yields a sample mean (statistic) that may differ from the population mean.
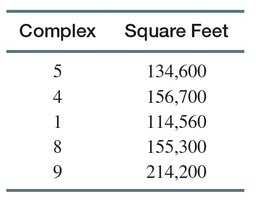
The sampling error is the difference between the sample mean and the population mean. For example, if the sample mean is 3,900 square feet less than the population mean, this is the sampling error.
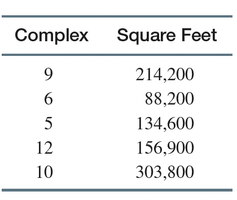
The size and sign of the sampling error depend on which sample is selected.
Sampling error can be positive or negative.
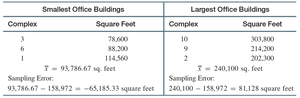
Sampling Error and Sample Size
The range of potential sampling error depends on sample size. Smaller samples tend to have larger ranges of sampling error, while larger samples reduce this range.
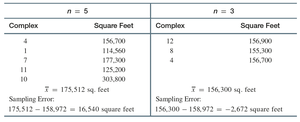
For n = 5, sampling error ranges from −50,740 to +51,928 square feet.
For n = 3, sampling error ranges from −65,185.33 to +81,128 square feet.
Larger sample sizes generally produce smaller average sampling errors, but there is no guarantee that any single sample will have a smaller error.
Sampling Distribution of the Mean
Concept and Definition
The sampling distribution of the mean is the distribution of all possible sample means for a given sample size, randomly selected from a population.
Sampling Distribution: The distribution of all possible values of a statistic for a given sample size.
Sampling error arises because a random sample will not perfectly match the population.
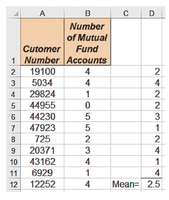
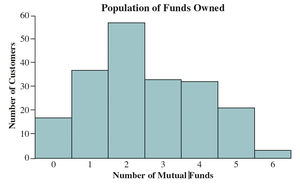
Business Application: Aspen Capital Management
A population of 200 customers is analyzed for the number of mutual funds owned.

Population mean: 2.505 funds
Population standard deviation: 1.503 funds
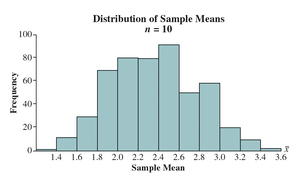
Random samples of size n = 10 are repeatedly drawn, and the sample means are computed.
After 500 samples, the distribution of sample means is approximately normal, even if the population distribution is skewed.

The mean of the sample means is close to the population mean.
Theorems of Sampling Distributions
Theorem 1: The average value of all possible sample means equals the population mean. The sample mean is an unbiased estimator of the population mean.
Theorem 2: The standard deviation of the sampling distribution (standard error) is the population standard deviation divided by the square root of the sample size:
As sample size increases, the standard error decreases and the distribution becomes more normal.
Theorem 3: If the population is normally distributed, the sampling distribution of the sample mean is also normal, with mean and standard deviation .
Consistent Estimator
A statistic is consistent if, as sample size increases, its value approaches the population parameter. The sample mean is a consistent estimator of the population mean.
z-Value for Sampling Distribution
The z-value measures how many standard errors a sample mean is from the population mean:
Example: Probability of Sample Mean in a Range
Given a normally distributed population, the probability that a sample mean falls within a certain range can be calculated using the z-value and the standard normal distribution.
Step 1: Compute sample mean.
Step 2: Define sampling distribution parameters.
Step 3: Convert sample mean to z-value.
Step 4: Use standard normal table to find probability.
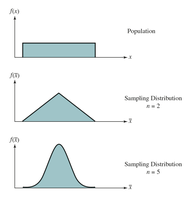
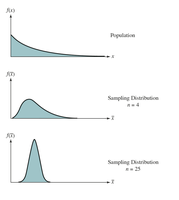
The Central Limit Theorem (CLT)
The CLT states that for sufficiently large sample sizes, the sampling distribution of the sample mean is approximately normal, regardless of the population's distribution.
Mean:
Standard deviation:
The approximation improves as sample size increases.
Sampling Distribution of a Proportion
Concept and Definitions
Sampling distributions also apply to sample proportions, which estimate population proportions. Sample proportions are subject to sampling error.
Sample Proportion: The fraction of items in a sample with the attribute of interest.
Population Proportion: The fraction of values in a population with a specific attribute.
Sampling error for proportions is the difference between the sample proportion and the population proportion.
Business Application: Patterson Health Clinic
Out of 80 patients, 72 responded "Yes" to a satisfaction survey, so the population proportion is 0.90. A random sample of 20 patients may yield a sample proportion that differs from the population proportion, resulting in sampling error.
The range of sampling error depends on which sample is selected.
Sampling error can be negative or positive.
Sampling Distribution of the Sample Proportion
The sampling distribution of the sample proportion is approximately normal if the sample size is large and and .
Mean:
Standard error:
z-Value for Sampling Distribution of Proportion
Business Application: On-Line Coupons, Inc.
Suppose 15% of coupons are not used (population proportion). A retailer reports 18% unused in a sample of 500 coupons. The probability of observing 18% or more unused coupons can be calculated using the sampling distribution of proportions.
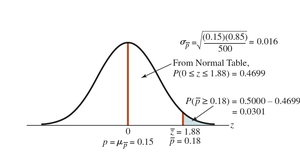
The sample proportion is 1.88 standard errors above the population proportion.
The probability of observing 18% or more unused coupons is 0.0301, indicating a rare event.
Summary Table: Key Formulas and Concepts
Concept | Formula | Description |
|---|---|---|
Population Mean | Mean of all values in the population | |
Sample Mean | Mean of values in the sample | |
Standard Error (Mean) | Standard deviation of sample means | |
Standard Error (Proportion) | Standard deviation of sample proportions | |
z-value (Mean) | Standardized distance from mean | |
z-value (Proportion) | Standardized distance from proportion |
Conclusion
Understanding sampling distributions is essential for making reliable inferences from sample data in business statistics. The concepts of sampling error, unbiased and consistent estimators, and the Central Limit Theorem provide a foundation for statistical decision-making and hypothesis testing.
