 Back
BackChapter 7: Introduction to Sampling Distributions – Business Statistics Study Notes
Study Guide - Smart Notes
 Tailored notes based on your materials, expanded with key definitions, examples, and context.
Introduction to Sampling Distributions
Overview
This chapter introduces the concept of sampling distributions, a fundamental topic in business statistics. It covers sampling error, the distribution of sample means and proportions, and the Central Limit Theorem, which underpins much of inferential statistics.
Sampling Error
Definition and Importance
Sampling error is the difference between a statistic calculated from a sample and the corresponding parameter from the population. It arises because samples are only subsets of the population and may not perfectly represent it.
Statistic: A measure computed from a sample (e.g., sample mean).
Parameter: A measure computed from the entire population (e.g., population mean).
Sampling Error: The difference between the sample statistic and the population parameter.
Sampling error can be positive or negative and varies depending on which sample is selected.
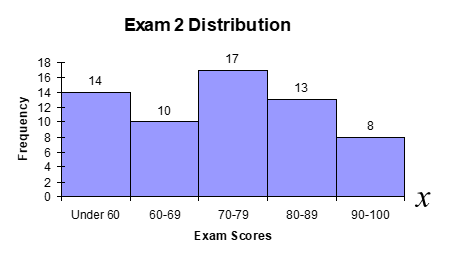
Example: Student Test Scores
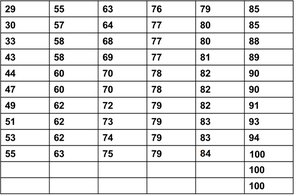
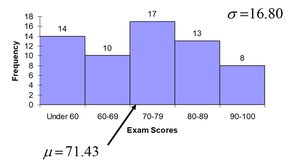
Consider a population of 62 students' mid-term exam scores. The population mean and standard deviation are calculated, and random samples are drawn to illustrate sampling error.
Sample means may differ from the population mean.
Sampling error is calculated as the difference between sample mean and population mean.
Sampling Error Calculation
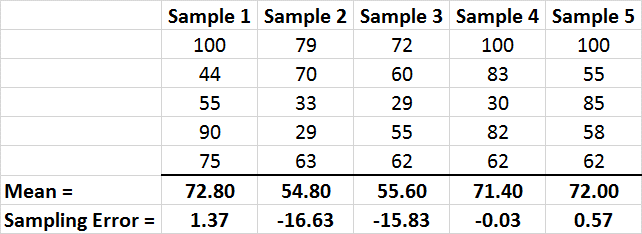
For each sample, the mean and sampling error are computed:
Sample | Mean | Sampling Error |
|---|---|---|
Sample 1 | 72.80 | 1.37 |
Sample 2 | 54.80 | -16.63 |
Sample 3 | 55.60 | -15.83 |
Sample 4 | 71.40 | -0.03 |
Sample 5 | 72.00 | 0.57 |
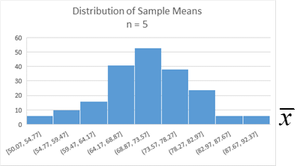
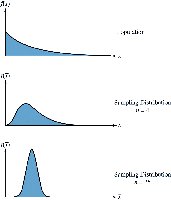
Distribution of Sample Means
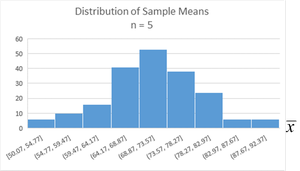
When many samples are taken, the distribution of sample means tends to be less variable than the population and is often approximately normal.
The average of sample means is close to the population mean.
Variation in sample means is less than variation in the population.
Sampling Distribution
Definition
A sampling distribution is the probability distribution of a given statistic based on a random sample. The most common are the sampling distributions of the sample mean and sample proportion.
Sample Mean Distribution: Shows how sample means vary from sample to sample.
Sample Proportion Distribution: Shows how sample proportions vary from sample to sample.
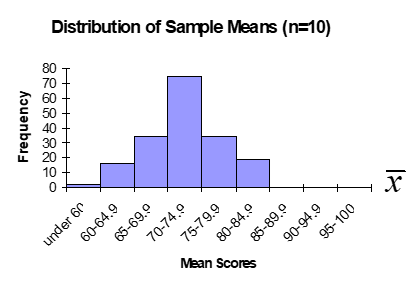
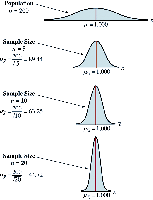
Effect of Sample Size
Larger sample sizes result in less variability in the distribution of sample means, making the sample mean a more reliable estimator of the population mean.
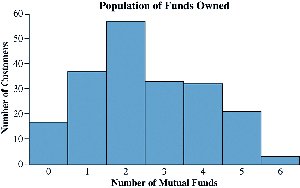
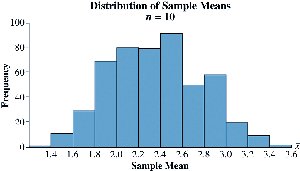
Mutual Fund Portfolio Example
Illustrates the concept using the number of mutual funds owned by customers. The distribution of sample means for 500 samples of size 10 is shown.
Theorems of Sampling Distributions
Theorem 1: Mean of Sample Means
The average value of all possible sample means equals the population mean:
Theorem 2: Standard Deviation of Sample Means
The standard deviation of sample means is the population standard deviation divided by the square root of the sample size:
Theorem 3: Normality of Sampling Distribution
If the population is normally distributed, the sampling distribution of the sample mean is also normal:
Mean:
Standard deviation:
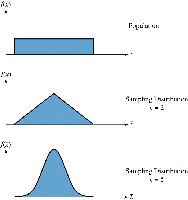
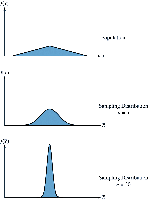
Theorem 4: Central Limit Theorem (CLT)
The CLT states that for sufficiently large sample sizes, the sampling distribution of the sample mean is approximately normal, regardless of the population's distribution.
Mean:
Standard deviation:
"Sufficiently large" is often defined as for most distributions.
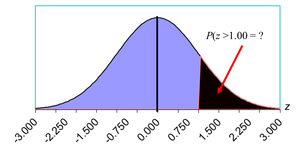
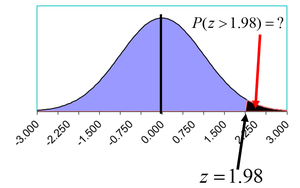
Standardization and z-values
z-value Calculation
A z-value measures how many standard deviations a sample mean is from the population mean:
z-values are used to determine probabilities from the standard normal distribution.
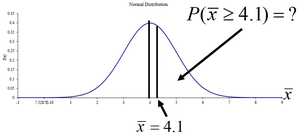
French Fry Example
Given a normal distribution of French fry lengths with mean 4.0 inches and standard deviation 1.0 inch, the probability of a sample mean exceeding 4.10 inches for a sample of 100 fries is calculated using z-values.
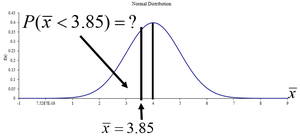
Another French Fry Example
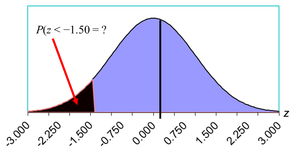
Probability that the mean of a sample of 64 fries is less than 3.85 inches:
Sampling Distribution of a Proportion
Definitions
Population Proportion (p): Fraction of values in a population with a specific attribute.
Sample Proportion (\bar{p}): Fraction of items in a sample with the attribute of interest.
Binomial Distribution: Underlying distribution for sample proportions.
Conditions for Normal Approximation
If the sample size is sufficiently large, the normal distribution can approximate the binomial distribution for sample proportions.
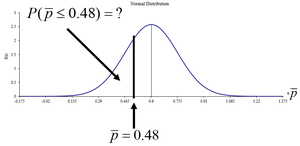
Retail Customers Example
Given a population proportion of 0.60, the probability of observing a sample proportion of 0.48 or less in a sample is calculated using z-values.
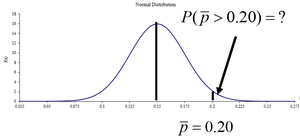
Income Tax Example
Given a population proportion of 0.15, the probability that more than 40 in a random sample of 200 have had a certain experience is calculated.
Summary and Key Points
Sampling error is inherent in sample statistics and varies with sample selection.
The distribution of sample means is less variable than the population and is approximately normal for large samples.
The Central Limit Theorem is fundamental for inferential statistics, allowing normal approximation for sample means and proportions.
z-values are used to standardize sampling distributions and calculate probabilities.
Additional info: The chapter provides practical examples and visualizations to reinforce the concepts of sampling error, sampling distributions, and the Central Limit Theorem, which are essential for understanding statistical inference in business contexts.
