 Back
BackChi-Square Tests: Homogeneity, Independence, and Goodness-of-Fit
Study Guide - Smart Notes
 Tailored notes based on your materials, expanded with key definitions, examples, and context.
Chi-Square Tests in Business Statistics
Chi-square tests are a family of statistical tests used to analyze categorical data. They help determine whether observed frequencies differ from expected frequencies under certain hypotheses. The main types relevant to business statistics are the Test of Homogeneity, Test of Independence, and the Goodness-of-Fit Test.
Test of Homogeneity
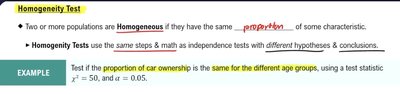
The Test of Homogeneity is used to determine whether two or more populations are homogeneous, meaning they have the same proportion of a certain characteristic. This test is commonly applied when comparing proportions across different groups.
Definition: Populations are homogeneous if they have the same proportion of a characteristic.
Hypotheses:
Null hypothesis (): All proportions are the same across populations.
Alternative hypothesis (): At least one proportion is different.
Example: Testing if the proportion of car ownership is the same for different age groups.
Comparison: Independence Test vs. Homogeneity Test
Both tests use similar calculations but differ in their hypotheses and study design:
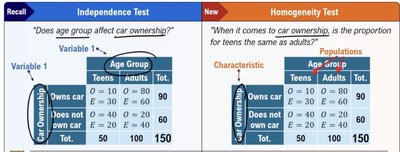
Independence Test: Examines if two variables are related within a single population.
Homogeneity Test: Compares proportions of a characteristic across different populations.
Test Statistic and Calculation
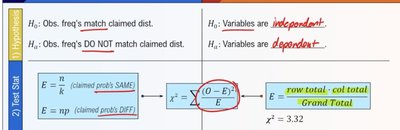
The test statistic for both tests is the chi-square statistic:
= observed frequency
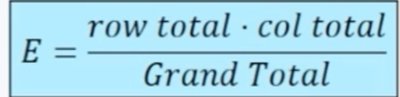
= expected frequency, calculated as:
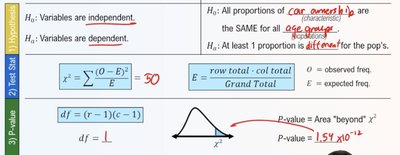
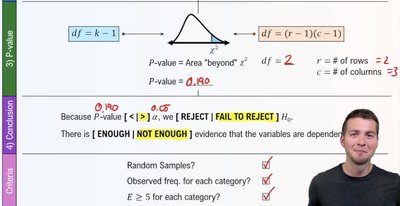
Degrees of Freedom (df): For a contingency table, , where is the number of rows and is the number of columns.
Example calculation:
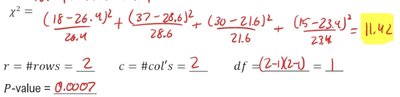
P-Value and Conclusion
The p-value is the probability of observing a test statistic as extreme as, or more extreme than, the one calculated, assuming the null hypothesis is true.
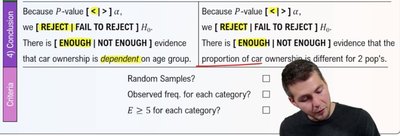
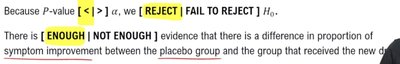
Decision rule: If -value , reject ; otherwise, fail to reject $H_0$.
Conclusion: State whether there is enough evidence to claim a difference in proportions.
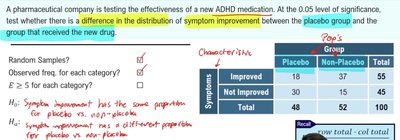
Application Example: Medical Study
Suppose a pharmaceutical company tests a new ADHD medication. At the 0.05 significance level, they test whether the distribution of symptom improvement differs between the placebo and treatment groups.
Null hypothesis (): The proportion of symptom improvement is the same for both groups.
Alternative hypothesis (): The proportions are different.
Symptoms | Placebo | Non-Placebo | Total |
|---|---|---|---|
Improved | 18 | 37 | 55 |
Not Improved | 30 | 15 | 45 |
Total | 48 | 52 | 100 |
Test of Independence
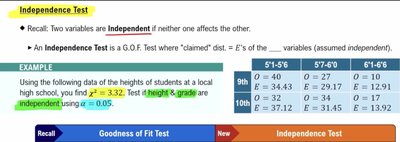
The Test of Independence determines whether two categorical variables are independent within a single population. It is often used to analyze survey or experimental data.
Definition: Two variables are independent if the occurrence of one does not affect the probability of the other.
Hypotheses:
Null hypothesis (): Variables are independent.
Alternative hypothesis (): Variables are dependent.
Example: Testing if height and grade are independent among students.
Test Statistic and Calculation
The test statistic is the same as for the homogeneity test:
Degrees of freedom:
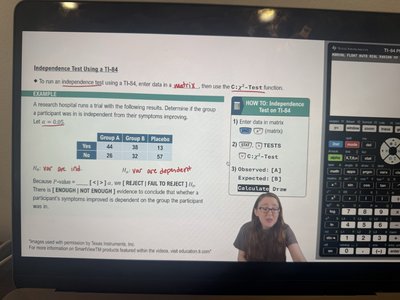
Calculator Application
Statistical calculators (e.g., TI-84) can be used to perform chi-square tests by entering observed data and selecting the appropriate test function.
Goodness-of-Fit Test (G.O.F.)
The Goodness-of-Fit Test compares observed frequencies to expected frequencies based on a claimed distribution. It is used to test if a sample matches a population distribution.
Hypotheses:
Null hypothesis (): Observed frequencies match the claimed distribution.
Alternative hypothesis (): Observed frequencies do not match the claimed distribution.
Test Statistic: Same chi-square formula as above.
Degrees of Freedom: , where is the number of categories.
Assumptions and Criteria for Chi-Square Tests
Random samples are used.
Observed frequencies are recorded for each category.
Expected frequency for each cell should be at least 5.
