 Back
BackInference for Proportions and Goodness-of-Fit Tests in Business Statistics
Study Guide - Smart Notes
 Tailored notes based on your materials, expanded with key definitions, examples, and context.
Inference for Proportions
Hypothesis Testing for Two Proportions
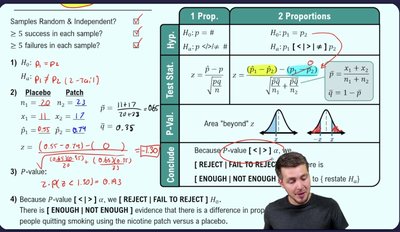
Hypothesis tests for two proportions are used to determine if there is a statistically significant difference between the proportions of two independent groups. This is commonly applied in business statistics to compare success rates, conversion rates, or proportions of categorical outcomes.
Null Hypothesis (H0): The proportions are equal, .
Alternative Hypothesis (Ha): The proportions are not equal, (two-tailed), or , (one-tailed).
Test Statistic: The z-test for proportions is used: where is the pooled proportion.
P-value: The probability of observing a test statistic as extreme as, or more extreme than, the observed value under the null hypothesis.
Decision Rule: If p-value < significance level (), reject H0. Otherwise, fail to reject H0.
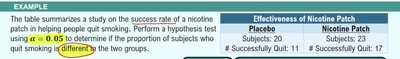
Example: Testing the effectiveness of a nicotine patch versus placebo in helping people quit smoking. The hypothesis test determines if the proportion of subjects who quit smoking is different between the two groups.
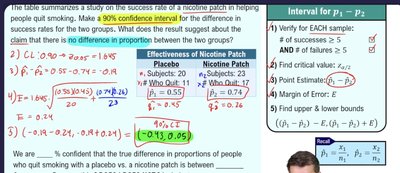
Confidence Intervals for Difference in Proportions
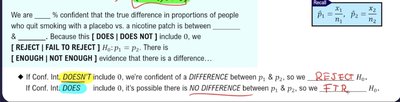
Confidence intervals estimate the range in which the true difference in proportions lies with a specified level of confidence. If the interval does not include zero, it suggests a significant difference between the groups.
Point Estimator:
Margin of Error:
Confidence Interval:
Interpretation: If the interval does not include 0, reject H0; otherwise, fail to reject H0.
Example: Calculating a 90% confidence interval for the difference in success rates between nicotine patch and placebo groups.
Using Statistical Tables
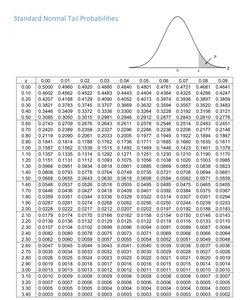
Statistical tables such as the z-table and t-table are used to find critical values and p-values for hypothesis tests and confidence intervals.
Standard Normal Table: Used for z-tests and finding tail probabilities.
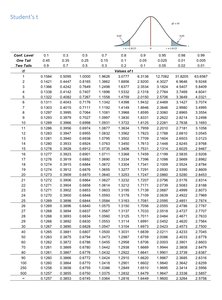
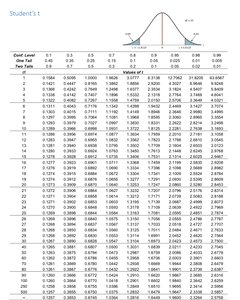
Student's t Table: Used for t-tests, especially when sample sizes are small or population standard deviation is unknown.
Goodness-of-Fit Tests
Chi-Square Goodness-of-Fit Test
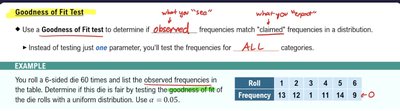
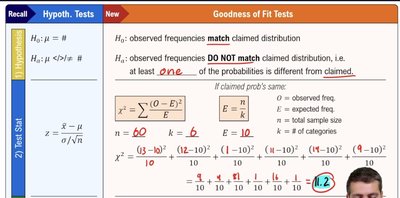
The chi-square goodness-of-fit test is used to determine whether observed frequencies match expected frequencies based on a claimed distribution. This is important in business statistics for validating models and assumptions about categorical data.
Null Hypothesis (H0): Observed frequencies match the claimed distribution.
Alternative Hypothesis (Ha): At least one of the probabilities is different from the claimed distribution.
Test Statistic: where O = observed frequency, E = expected frequency.
Degrees of Freedom: (k = number of categories).
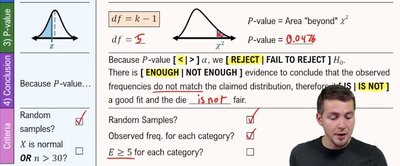
P-value: Area under the chi-square curve beyond the calculated statistic.
Decision Rule: If p-value < , reject H0.
Example: Testing if a die is fair based on observed roll frequencies.
Goodness-of-Fit Test for Unequal Probabilities
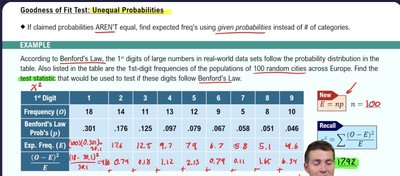
When claimed probabilities are not equal, expected frequencies are calculated using the given probabilities for each category.
Expected Frequency: for each category.
Application: Used in real-world scenarios such as Benford's Law, where the probability distribution is not uniform.
Example: Testing if the distribution of first digits in city populations follows Benford's Law.
Homogeneity Tests
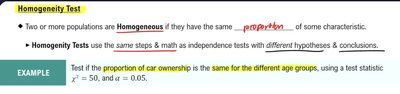
Homogeneity tests are used to determine if two or more populations have the same proportion of a characteristic. The steps and math are similar to independence tests but with different hypotheses and conclusions.
Null Hypothesis (H0): The proportions are the same across groups.
Alternative Hypothesis (Ha): The proportions are not the same.
Test Statistic: calculated as in the goodness-of-fit test.
Example: Testing if the proportion of car ownership is the same for different age groups.
Summary Table: Hypothesis Testing and Confidence Intervals for Proportions
Test | Null Hypothesis | Test Statistic | Decision Rule |
|---|---|---|---|
Two Proportions | Reject H0 if p-value < | ||
Confidence Interval | N/A | Reject H0 if interval does not include 0 | |
Goodness-of-Fit | Observed matches claimed | Reject H0 if p-value < | |
Homogeneity | Proportions same across groups | Reject H0 if p-value < |
Additional info:
All examples and images are directly relevant to business statistics topics: hypothesis testing for proportions, confidence intervals, and chi-square tests for categorical data.
Statistical tables are included for reference and calculation of critical values and p-values.
