 Back
BackRandom Variables and Probability Distributions: Study Notes for Business Statistics
Study Guide - Smart Notes
 Tailored notes based on your materials, expanded with key definitions, examples, and context.
Random Variables and Probability Distributions
Definition and Examples of Random Variables
A random variable is a variable that assumes numerical values associated with the random outcomes of an experiment. Each sample point in the experiment is assigned one (and only one) numerical value.
Example 1: Tossing a die, the number on the up face (1-6) is a random variable X.
Example 2: Flipping two coins, the total number of heads (0, 1, or 2) is a random variable Y.
Types of Random Variables
Random variables are classified as either discrete or continuous based on the nature of their possible values.
Discrete random variables: Can assume a countable number of values (finite or infinite). Examples: Number of sales made in a week (0, 1, 2, ...), number of consumers favoring a product in a sample (0 to 500).
Continuous random variables: Can assume values corresponding to any point in one or more intervals (uncountable, infinite). Examples: Time between arrivals at a clinic (0 ≤ x < ∞), amount of beverage in a can (0 ≤ x ≤ 12).
Countable sets include integers and rational numbers, while uncountable sets include real numbers.
Describing Discrete Random Variables
A discrete random variable is described by listing its possible values and the probability associated with each value. This is known as the probability distribution of the random variable.
Requirements for a probability distribution:
All probabilities must be non-negative: for all x.
The sum of all probabilities must equal 1: .
Example: Tossing two fair coins, let x be the number of heads observed. The probability distribution can be represented as a table or graph.
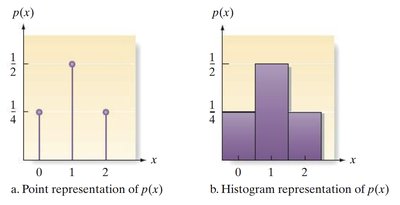
The left graph shows the point representation of , and the right graph shows the histogram representation of $p(x)$ for the number of heads observed when tossing two coins.
Mean (Expected Value) of a Discrete Random Variable
The mean (or expected value) of a discrete random variable x is a measure of the central tendency of its probability distribution.
Formula:
The mean is the average value of x over a large number of repetitions of the experiment.
Example: Rolling a die, and for each. .
Variance and Standard Deviation of a Discrete Random Variable
The variance and standard deviation measure the spread or variability of the probability distribution.
Variance:
Standard deviation:
Example: For a fair die, calculate variance and standard deviation using the above formulas.
Empirical Rule for Probability Distributions
The Empirical Rule applies to mound-shaped, symmetric distributions:
Approximately 68% of values fall within one standard deviation of the mean:
Approximately 95% within two standard deviations:
Approximately 99.7% within three standard deviations:
Binomial Distribution: A Special Discrete Distribution
The binomial distribution describes the number of successes in a fixed number of independent trials, each with the same probability of success.
Binomial experiment characteristics:
n identical trials
Two possible outcomes per trial (Success S, Failure F)
Probability of success (p) is constant; probability of failure (q) = 1 - p
Trials are independent
Binomial random variable x: Number of successes in n trials
Probability distribution formula:
Where
Example: If a machine produces 10% defectives, and 5 items are tested, the probability that 3 are defective is calculated using the binomial formula.
Mean and Variance of Binomial Random Variables
Mean:
Variance:
Standard deviation:
Excel functions for binomial probabilities:
Probability of exactly a successes: =binom.dist(a, n, p, FALSE)
Probability of at most a successes: =binom.dist(a, n, p, TRUE)
For other probabilities, use complementary rules and the binomial formula.
