 Back
BackRandom Variables, Expected Value, Variance, and Standard Deviation in Business Statistics
Study Guide - Smart Notes
 Tailored notes based on your materials, expanded with key definitions, examples, and context.
Random Variables and Probability Models
Definition and Types of Random Variables
Random variables (RVs) are numerical outcomes of random experiments. They are fundamental in business statistics for modeling uncertainty and quantifying outcomes.
Random Variable (X): A variable representing the outcome of a random process, such as the number of points scored in a football possession.
Discrete Random Variables: Can only take specific, separate values (e.g., 1, 2, 3).
Continuous Random Variables: Can take any value within a given range (e.g., distance, time).


Sample Space (S): The set of all possible values a random variable can take. For example, S = {0, 3, 7} for points scored in a football possession.
Probability Model
A probability model assigns probabilities to each possible value of a random variable. The probability function f(x0) = P(X = x0) gives the probability that X equals a specific value.
Example: For points scored: f(x0) = 12/46 when x = 0, 10/46 when x = 3, 24/46 when x = 7, 0 otherwise.
Expected Value (Mean) of a Random Variable
Definition and Calculation
The expected value (E(X)) of a random variable is the long-run average value of repetitions of the experiment it represents. It is a measure of central tendency for the probability distribution.
Formula:
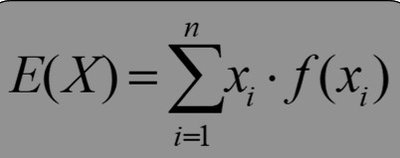
Example: For points scored:
Interpretation: The mean or expected number of points scored from a red zone possession is 4.304 points.

Variance and Standard Deviation of a Random Variable
Definition and Calculation
The variance and standard deviation measure the spread or dispersion of a random variable's possible values.
Variance (Var(X)): The average of the squared differences from the mean.
Standard Deviation (SD(X)): The square root of the variance, representing spread in the same units as the variable.
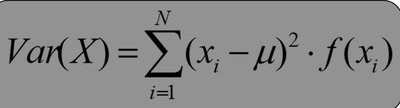
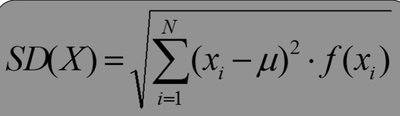
Example: For points scored:
Standard Deviation: points
Applications: Expected Value and Variance in Gambling
Roulette Example
Expected value and variance are used to analyze games of chance, such as Roulette, to determine the average outcome and risk.

Betting on Red/Black: (expected loss per $1 bet)
Betting on a Single Number: (same expected loss per $1 bet)
Variance and Standard Deviation: Betting on a single number has much higher variance and standard deviation than betting on red/black, indicating higher risk.

Properties of Expected Value and Variance
Linear Properties
Scaling: and
Sum of Random Variables:
Variance of Sums (Independent Variables):
Nonlinear Operators: and unless X and Y are independent.
Examples with Dice
Expected Value and Variance for Dice Rolls
Rolling dice is a classic example of discrete random variables in probability models.
Single Die: ,
Sum of Two Dice: ,
Difference of Two Dice: ,
Table: Probability Distribution for Sum of Two Dice
Sum (y) | Probability f(y) |
|---|---|
2 | 1/36 |
3 | 2/36 |
4 | 3/36 |
5 | 4/36 |
6 | 5/36 |
7 | 6/36 |
8 | 5/36 |
9 | 4/36 |
10 | 3/36 |
11 | 2/36 |
12 | 1/36 |
Key Takeaways
Random variables model uncertainty in business and games of chance.
Expected value provides the long-run average outcome; variance and standard deviation measure risk or spread.
Properties of expectation and variance are essential for analyzing sums, differences, and scaled random variables.
Always use variance (not standard deviation) when adding or subtracting independent random variables.
