 Back
BackSampling Distributions, Estimation, and Data Types in Business Statistics
Study Guide - Smart Notes
 Tailored notes based on your materials, expanded with key definitions, examples, and context.
Sampling Distributions and Estimation
Introduction to Sampling Distributions
Sampling distributions are fundamental in business statistics, as they describe the variability of sample statistics (such as means or proportions) when repeatedly sampling from a population. Understanding these distributions allows us to make inferences about population parameters based on sample data.
Population: The entire group about which information is sought (e.g., all consumers in Ottawa).
Sample: A subset of the population selected for analysis.
Population Parameter: The true value of interest in the population (e.g., mean income).
Sample Statistic: The value calculated from the sample (e.g., sample mean).
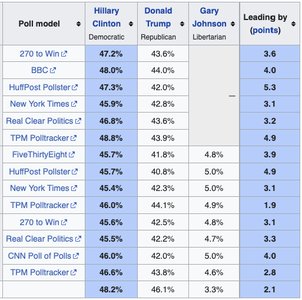
Example: Estimating the proportion of consumers interested in a new product by polling a sample from downtown Ottawa.

Value and Challenges of Sampling
Sampling is valuable for making business decisions, but its effectiveness depends on the representativeness and size of the sample. Poor sampling can lead to misleading conclusions.
Representativeness: The sample should reflect the population's characteristics.
Sample Size: Larger samples reduce variability and increase confidence in estimates.
Bias: Systematic errors that cause the sample statistic to differ from the population parameter.
Variability: The degree to which sample statistics differ across samples.

Historical Examples of Sampling Errors
Historical polling errors illustrate the importance of proper sampling methods. For example, the 1936 US presidential election poll by Literary Digest failed due to selection bias, while George Gallup's random sampling produced more accurate results.
Selection Bias: Occurs when certain groups are systematically excluded from the sample.
Simple Random Sample (SRS): Every member of the population has an equal chance of being selected.


Types of Data
Categorical vs. Numerical Data
Data in business statistics can be classified as categorical (qualitative) or numerical (quantitative). The distinction determines the appropriate statistical methods for analysis.
Categorical Data: Describes qualities or categories (e.g., vehicle type, satisfaction).
Numerical Data: Measures quantities (e.g., distance driven, grades).
Discrete Data: Takes specific values (e.g., rating scale).
Continuous Data: Can take any value within a range (e.g., temperature).
Application: Proportions are meaningful for categorical data, while averages are meaningful for numerical data.
Evaluating Sample Statistics
Bias and Variability
A "good" statistic is both unbiased and has low variability. Unbiased statistics have a long-run average equal to the population parameter, while low variability means sample statistics are close together.
Unbiased: No tendency to over- or underestimate the parameter.
Low Variability: Sample statistics do not vary dramatically between samples.
Examples:
Estimating mean height of students using a random sample vs. a specific group (e.g., basketball team).
Estimating average income using 100 vs. 1000 random tax returns.


Sampling Distribution of the Mean
Concept and Properties
The sampling distribution of the mean describes the distribution of sample means from repeated samples of the same size. It is a random variable, and its properties depend on the population and sample size.
Mean of Sampling Distribution: Equal to the population mean if the sample mean is unbiased.
Variance: Increases with population variance, decreases with sample size.

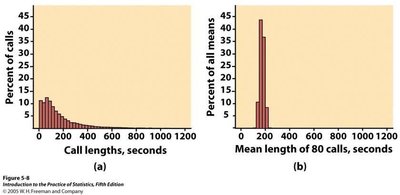
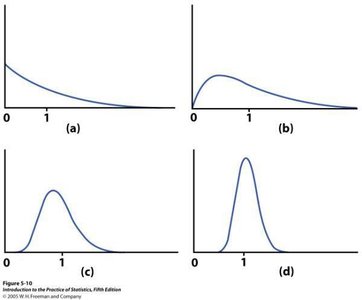
Central Limit Theorem (CLT)
The Central Limit Theorem states that, for large sample sizes, the sampling distribution of the sample mean is approximately normal, regardless of the population's distribution.
Normal Population: If the population is normal, the sample mean is normal for any sample size.
Non-Normal Population: For large n, the sample mean is approximately normal.
Sample Size: "Large enough" depends on the population's symmetry; n > 30 is often sufficient, but more may be needed for skewed distributions.
Formula:
Mean:
Standard Deviation:

Estimating Proportions and Binomial Distribution
Sample Proportion and Its Distribution
When estimating proportions, the sample proportion is the number of successes divided by the sample size. For binary outcomes, the count of successes follows a binomial distribution.
Sample Proportion:
Binomial Distribution:
Mean:
Standard Deviation:
Example: Surveying 100 people about seasonal preference, expecting 50 ± 5 to prefer summer if p = 0.5.
Normal Approximation to Binomial
For large n, the binomial distribution can be approximated by a normal distribution. This is useful for calculating probabilities when n is large.
Rule of Thumb: Use normal approximation if and .
Normal Distribution Notation:
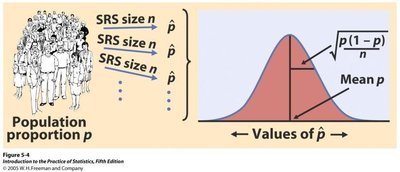
Sampling Distribution of the Sample Proportion
The sampling distribution of the sample proportion is approximately normal for large n, with mean equal to the population proportion and standard deviation depending on n and p.
Mean:
Standard Deviation:
Summary Table: Key Properties of Sampling Distributions
Statistic | Mean | Standard Deviation | Distribution (for large n) |
|---|---|---|---|
Sample Mean () | Normal | ||
Sample Proportion () | Normal (if and ) | ||
Count of Successes () | Binomial / Normal (large n) |
Conclusion
Understanding sampling distributions, bias, variability, and the distinction between categorical and numerical data is essential for making reliable inferences in business statistics. Proper sampling methods and awareness of distribution properties ensure accurate estimation of population parameters.
