Join thousands of students who trust us to help them ace their exams!
Multiple Choice
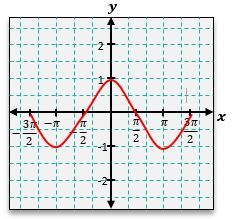
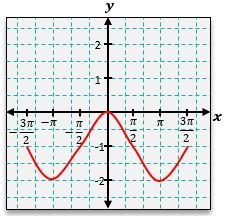
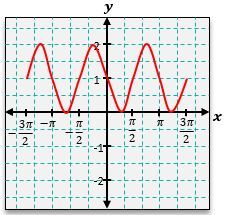
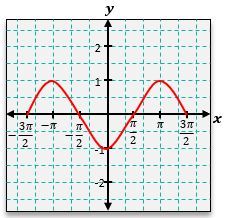
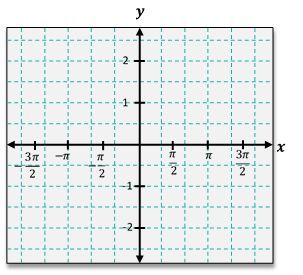
Sketch the function y=cos(x)−1 on the graph below.
A
B
C
D
0 Comments
Verified step by step guidance
1
Identify the function to be sketched: y = cos(x) - 1. This is a vertical shift of the basic cosine function y = cos(x).
Understand the transformation: The graph of y = cos(x) is shifted downward by 1 unit. This means every point on the graph of y = cos(x) is moved 1 unit down.
Determine key points: The maximum value of cos(x) is 1, so the maximum value of y = cos(x) - 1 is 0. The minimum value of cos(x) is -1, so the minimum value of y = cos(x) - 1 is -2.
Identify the period: The period of the cosine function is 2π. This means the graph will repeat every 2π units along the x-axis.
Sketch the graph: Start by plotting the key points (maximum, minimum, and intercepts) and then draw a smooth curve through these points, ensuring the graph repeats every 2π units.


 Verified step by step guidance
