57–64. Graphing polar curves Graph the following equations. Use a graphing utility to check your work and produce a final graph.
r = sin 3θ
Verified step by step guidance
1
Understand the given polar equation: \(r = \sin 3\theta\). This represents a polar curve where the radius \(r\) depends on the angle \(\theta\) multiplied by 3 inside the sine function.
Recall that equations of the form \(r = \sin n\theta\) produce rose curves with petals. If \(n\) is an integer, the number of petals depends on whether \(n\) is odd or even: for odd \(n\), the rose has \(n\) petals; for even \(n\), it has \$2n$ petals.
To graph the curve, create a table of values by choosing several values of \(\theta\) between \(0\) and \(2\pi\), calculate \(r\) for each, and plot the points \((r, \theta)\) in polar coordinates. For example, evaluate \(r\) at \(\theta = 0, \frac{\pi}{6}, \frac{\pi}{4}, \frac{\pi}{3}, \ldots\)
Plot the points on polar graph paper or using a graphing utility, connecting the points smoothly to reveal the petal shapes. Notice the symmetry and periodicity of the curve as \(\theta\) increases.
Use a graphing utility to check your hand-drawn graph. Input the equation \(r = \sin 3\theta\) and compare the plotted curve to your sketch, ensuring the number of petals and their orientation match.
Verified video answer for a similar problem:
This video solution was recommended by our tutors as helpful for the problem above
Video duration:
2m
Play a video:
0 Comments
Key Concepts
Here are the essential concepts you must grasp in order to answer the question correctly.
Polar Coordinates and Polar Equations
Polar coordinates represent points using a radius and an angle (r, θ) instead of Cartesian (x, y). Understanding how r changes with θ is essential for graphing polar equations like r = sin 3θ, where the radius depends on the angle multiplied by a factor.
Graphing polar curves involves plotting points for various values of θ and connecting them smoothly. Recognizing patterns such as petals or loops, especially in equations like r = sin nθ, helps predict the shape and symmetry of the graph.
Graphing utilities, such as graphing calculators or software, allow for accurate visualization of complex polar curves. They help verify manual sketches and reveal detailed features like the number of petals and symmetry in curves like r = sin 3θ.

 Verified step by step guidance
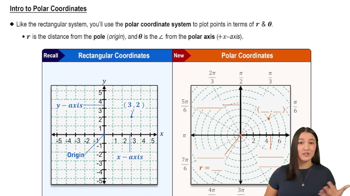
 05:32
05:32