Use shifts and scalings to graph the given functions. Then check your work with a graphing utility. Be sure to identify an original function on which the shifts and scalings are performed.
Verified step by step guidance
1
Identify the original function: The given function is a quadratic function, which can be related to the basic form \( f(x) = x^2 \).
Rewrite the function in vertex form: Start by completing the square for the expression \(-4x^2 - 4x + 12\).
Factor out the coefficient of \(x^2\) from the first two terms: \(-4(x^2 + x) + 12\).
Complete the square inside the parentheses: Add and subtract \(\left(\frac{1}{2}\right)^2 = \frac{1}{4}\) inside the parentheses, adjusting for the factor of \(-4\).
Rewrite the function in vertex form: \(h(x) = -4((x + \frac{1}{2})^2 - \frac{1}{4}) + 12\), and simplify to identify shifts and scalings.
Verified video answer for a similar problem:
This video solution was recommended by our tutors as helpful for the problem above
Video duration:
8m
Play a video:
0 Comments
Key Concepts
Here are the essential concepts you must grasp in order to answer the question correctly.
Graph Transformations
Graph transformations involve shifting and scaling functions to create new graphs from original ones. Shifts can be vertical or horizontal, moving the graph up, down, left, or right, while scalings stretch or compress the graph vertically or horizontally. Understanding these transformations helps in visualizing how changes to the function's equation affect its graph.
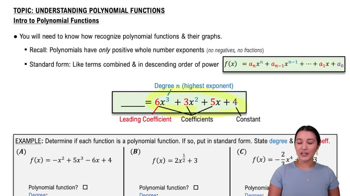
Quadratic functions are polynomial functions of degree two, typically expressed in the form f(x) = ax^2 + bx + c. The graph of a quadratic function is a parabola, which can open upwards or downwards depending on the sign of the coefficient 'a'. Recognizing the standard form of a quadratic function is essential for identifying its vertex, axis of symmetry, and intercepts.
Graphing utilities are software or tools that allow users to visualize mathematical functions and their transformations. These tools can plot graphs accurately and provide immediate feedback on the effects of shifts and scalings. Using a graphing utility is a practical way to verify the transformations applied to a function and to explore its behavior visually.

 Verified step by step guidance
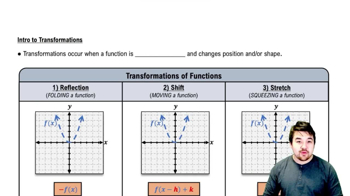
 5:25
5:25