Use shifts and scalings to graph the given functions. Then check your work with a graphing utility. Be sure to identify an original function on which the shifts and scalings are performed.
Verified step by step guidance
1
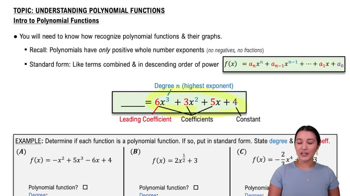
Identify the original function: The original function is f(x) = x^2, which is a basic parabola opening upwards.
Apply the vertical scaling: The function g(x) = -3x^2 involves a vertical scaling by a factor of 3. This means the parabola becomes narrower compared to f(x) = x^2.
Apply the reflection: The negative sign in front of the 3 indicates a reflection over the x-axis. This means the parabola, which originally opened upwards, now opens downwards.
Combine the transformations: The transformations applied to f(x) = x^2 result in the function g(x) = -3x^2, which is a downward-opening parabola that is narrower than the original.
Verify with a graphing utility: Use a graphing calculator or software to plot g(x) = -3x^2 and confirm that it matches the described transformations.
Verified video answer for a similar problem:
This video solution was recommended by our tutors as helpful for the problem above
Video duration:
9m
Play a video:
0 Comments
Key Concepts
Here are the essential concepts you must grasp in order to answer the question correctly.
Function Transformations
Function transformations involve shifting and scaling the graph of a function. Shifts can be vertical or horizontal, moving the graph up, down, left, or right, while scalings affect the graph's width and height. Understanding how these transformations affect the original function is crucial for accurately graphing the modified function.
Quadratic functions are polynomial functions of degree two, typically expressed in the form f(x) = ax^2 + bx + c. The graph of a quadratic function is a parabola, which can open upwards or downwards depending on the sign of the coefficient 'a'. In this case, the function g(x) = -3x^2 represents a downward-opening parabola due to the negative coefficient.
Graphing utilities are software tools or calculators that allow users to visualize mathematical functions and their transformations. These tools can help verify the accuracy of hand-drawn graphs by providing a precise graphical representation. Utilizing a graphing utility is essential for confirming the results of shifts and scalings applied to the original function.

 Verified step by step guidance
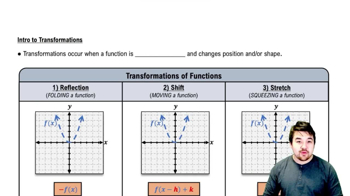
 5:25
5:25