Graphing functions Use the guidelines of this section to make a complete graph of f.
f(x) = e⁻ˣ²/₂
Verified step by step guidance
1
Identify the function: The given function is \( f(x) = e^{-x^2/2} \). This is a Gaussian function, which is a type of bell curve centered at the origin.
Determine the domain and range: The domain of \( f(x) \) is all real numbers, \( (-\infty, \infty) \), because the exponential function is defined for all real numbers. The range is \( (0, 1] \) because \( e^{-x^2/2} \) is always positive and reaches a maximum value of 1 when \( x = 0 \).
Find the symmetry: The function \( f(x) = e^{-x^2/2} \) is an even function because \( f(-x) = f(x) \). This means the graph is symmetric with respect to the y-axis.
Determine the critical points: To find critical points, compute the derivative \( f'(x) \) and set it to zero. The derivative is \( f'(x) = -x e^{-x^2/2} \). Setting \( f'(x) = 0 \) gives \( x = 0 \) as the only critical point. Since \( f'(x) \) changes sign around \( x = 0 \), this is a maximum point.
Analyze the behavior at infinity: As \( x \to \pm\infty \), \( e^{-x^2/2} \to 0 \). This means the graph approaches the x-axis but never touches it, indicating horizontal asymptotes at \( y = 0 \).
Verified video answer for a similar problem:
This video solution was recommended by our tutors as helpful for the problem above
Video duration:
6m
Play a video:
0 Comments
Key Concepts
Here are the essential concepts you must grasp in order to answer the question correctly.
Exponential Functions
Exponential functions are mathematical functions of the form f(x) = a^x, where 'a' is a constant. In the given function f(x) = e^(-x²/2), 'e' is the base of the natural logarithm, approximately equal to 2.71828. Understanding the behavior of exponential functions, especially with negative exponents, is crucial for graphing as they determine the function's growth or decay.
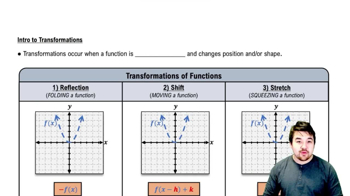
Transformations involve shifting, stretching, or compressing the graph of a function. For f(x) = e^(-x²/2), the exponent -x²/2 indicates a horizontal reflection and a vertical compression. Recognizing these transformations helps in predicting the shape and orientation of the graph, which is essential for accurate plotting.
Critical points, where the derivative is zero or undefined, help identify local maxima, minima, or points of inflection. For f(x) = e^(-x²/2), symmetry about the y-axis is evident due to the even power of x. Analyzing these aspects allows for a more complete understanding of the function's behavior and assists in creating a detailed graph.

 Verified step by step guidance
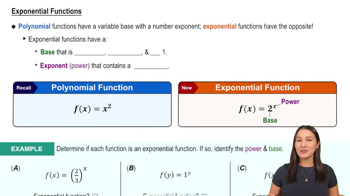
 6:13
6:13