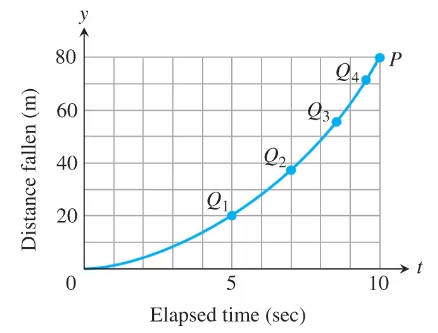
The accompanying figure shows the plot of distance fallen versus time for an object that fell from the lunar landing module a distance 80 m to the surface of the moon. a. Estimate the slopes of the secant lines PQ₁, PQ₂, PQ₃, and PQ₄, arranging them in a table like the one in Figure 2.6.
b. About how fast was the object going when it hit the surface?
Verified step by step guidance
1
Step 1: Understand the problem context. We are analyzing the motion of an object falling from a lunar landing module to the surface of the moon. The task involves estimating the slopes of secant lines on a distance-time graph, which represent average velocities over specific intervals.
Step 2: Identify the points on the graph where the secant lines PQ₁, PQ₂, PQ₃, and PQ₄ are drawn. These points correspond to specific time intervals and distances fallen. The slope of each secant line is calculated using the formula for average velocity: \( \text{slope} = \frac{\Delta y}{\Delta x} \), where \( \Delta y \) is the change in distance and \( \Delta x \) is the change in time.
Step 3: Calculate the slope for each secant line. For each pair of points (P and Q), determine the change in distance (\( \Delta y \)) and the change in time (\( \Delta x \)). Use these values to compute the slope using the formula \( \text{slope} = \frac{\Delta y}{\Delta x} \). Arrange these slopes in a table similar to Figure 2.6.
Step 4: To estimate how fast the object was going when it hit the surface, consider the slope of the tangent line at the point where the object reaches the surface. This slope represents the instantaneous velocity at that moment. You can approximate this by observing the trend of the secant line slopes as the object approaches the surface.
Step 5: Reflect on the physical meaning of the slopes. The slopes of the secant lines give us average velocities over intervals, while the slope of the tangent line at the surface provides the instantaneous velocity. This analysis helps us understand the object's motion and speed upon impact.
Verified video answer for a similar problem:
This video solution was recommended by our tutors as helpful for the problem above
Video duration:
4m
Play a video:
0 Comments
Key Concepts
Here are the essential concepts you must grasp in order to answer the question correctly.
Secant Lines
Secant lines are straight lines that connect two points on a curve. In the context of the distance versus time graph, the slope of a secant line represents the average velocity of the object between the two points. By estimating the slopes of the secant lines PQ₁, PQ₂, PQ₃, and PQ₄, we can analyze how the object's speed changes over time as it falls.
The slope of a line is a measure of its steepness, calculated as the change in the vertical direction (rise) divided by the change in the horizontal direction (run). In this scenario, the slope of the secant lines will provide the average speed of the object over specific intervals of time. Understanding how to calculate and interpret slopes is essential for analyzing motion in calculus.
Instantaneous velocity refers to the speed of an object at a specific moment in time, as opposed to average velocity over an interval. To find the instantaneous velocity of the object when it hits the surface, one can take the limit of the average velocities as the time interval approaches zero. This concept is crucial for understanding how an object's speed changes at any given point during its fall.

 Verified step by step guidance
 05:13
05:13