(Use of Tech) Finger curves: r = f(θ) = cos(aᶿ) - 1.5, where a = (1 + 12π)^(1/(2π)) ≈ 1.78933 d. Plot the curve with various values of k. How many fingers can you produce?
Verified step by step guidance
1
Understand the given polar curve equation: \(r = f(\theta) = \cos(a\theta) - 1.5\), where \(a = (1 + 12\pi)^{\frac{1}{2\pi}}\). This defines the radius \(r\) as a function of the angle \(\theta\).
Recognize that the parameter \(a\) controls the frequency of the cosine function inside the polar equation, which affects the number of 'fingers' or lobes in the plot.
To explore how the number of fingers changes, vary the parameter \(k\) in the expression for \(a\), for example by replacing \(a\) with \(k\) in the function \(r = \cos(k\theta) - 1.5\) and plotting for different values of \(k\).
For each chosen value of \(k\), plot the curve in polar coordinates over a full rotation, typically \(\theta\) from \(0\) to \(2\pi\), to observe the shape and count the number of distinct lobes or fingers formed.
Analyze the plots to determine the relationship between \(k\) and the number of fingers: generally, the number of fingers corresponds to the integer part of \(k\) or related to the frequency of the cosine term, so by increasing \(k\), you can produce more fingers.
Verified video answer for a similar problem:
This video solution was recommended by our tutors as helpful for the problem above
Video duration:
2m
Play a video:
0 Comments
Key Concepts
Here are the essential concepts you must grasp in order to answer the question correctly.
Polar Coordinates and Curves
Polar coordinates represent points using a radius and an angle (r, θ), allowing curves to be defined as functions of θ. Understanding how to interpret and plot r = f(θ) is essential for visualizing shapes like finger curves, where the radius changes with the angle.
Parameters within the function, such as 'a' in r = cos(aθ) - 1.5, control the frequency and number of oscillations in the curve. Varying these parameters changes the number of 'fingers' or lobes in the plot, so analyzing their effect helps predict and count the features formed.
Graphing software or calculators can plot complex polar functions efficiently, allowing exploration of how different parameter values affect the curve. Using technology helps visualize the number of fingers produced and understand the behavior of the function dynamically.

 Verified step by step guidance
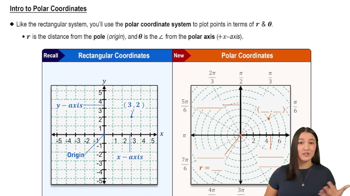
 05:32
05:32