 Back
BackAnalyzing and Sketching the Derivative from a Graph
Study Guide - Smart Notes
 Tailored notes based on your materials, expanded with key definitions, examples, and context.
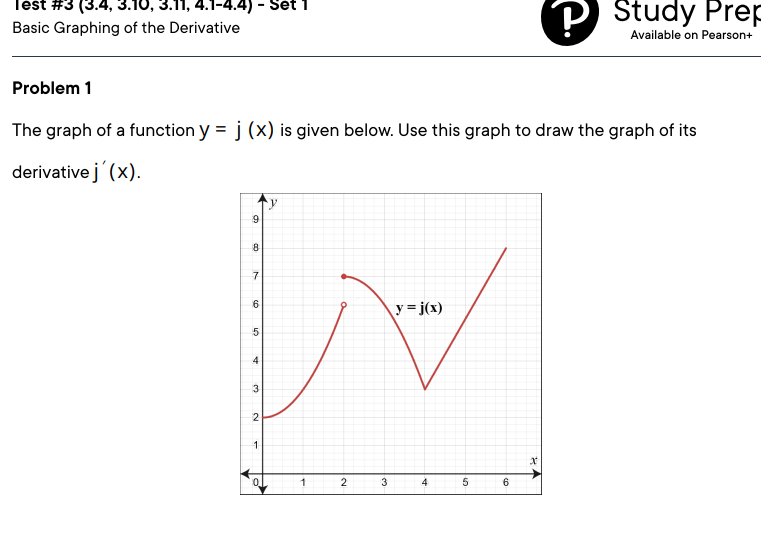
Q1. The graph of a function is given below. Use this graph to draw the graph of its derivative .
Background
Topic: Graphical Interpretation of Derivatives
This question tests your understanding of how to interpret and sketch the derivative of a function based on the graph of the original function. You need to analyze the slopes of the tangent lines to the curve at various points and use that information to sketch the graph of .
Key Terms and Concepts:
Derivative : The derivative at a point gives the slope of the tangent line to the graph of at that point.
Critical Points: Points where the slope is zero (horizontal tangent), which often correspond to local maxima or minima.
Increasing/Decreasing: Where is increasing, is positive; where $j(x)$ is decreasing, $j'(x)$ is negative.
Inflection Points: Where the concavity changes, the derivative may have a local extremum.
Step-by-Step Guidance
Identify intervals where is increasing and decreasing. On intervals where $j(x)$ increases, will be above the -axis (positive); where $j(x)$ decreases, $j'(x)$ will be below the $x$-axis (negative).
Locate points where the tangent to is horizontal (slope = 0). These are the -values where (crosses the $x$-axis).
Estimate the steepness of the graph at various points. Where is steepest (either up or down), will be largest (positive for upward, negative for downward).
Note any sharp corners or discontinuities in . At these points, may be undefined or have a jump.
Begin sketching by plotting the zeroes, positive and negative regions, and relative maxima/minima based on your analysis above.
Try solving on your own before revealing the answer!
Final Answer: Sketch of
The graph of will cross the -axis at the $x$-values where has horizontal tangents (local max/min). It will be positive where $j(x)$ is increasing and negative where $j(x)$ is decreasing. The steepest slopes on $j(x)$ correspond to the highest/lowest points on $j'(x)$.
By carefully analyzing the original graph, you can sketch the derivative by following the steps above.
