 Back
BackGraphing the Exponential Function $f(x) = -1 + e^x$
Study Guide - Smart Notes
 Tailored notes based on your materials, expanded with key definitions, examples, and context.
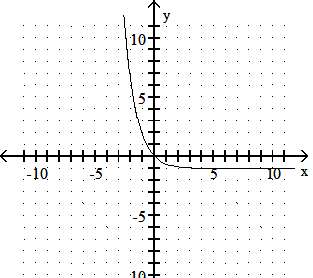
Q6. Graph the function .
Background
Topic: Exponential Functions and Their Graphs
This question tests your understanding of how to graph exponential functions, specifically how transformations such as vertical shifts affect the basic graph of .
Key Terms and Formulas
Exponential Function: is the basic exponential function with base .
Vertical Shift: Adding or subtracting a constant outside the function shifts the graph up or down.
Step-by-Step Guidance
Start by recalling the basic shape of . This function passes through and increases rapidly as increases.
Notice the transformation: means the entire graph of is shifted down by 1 unit.
Find the new -intercept by evaluating : .
Determine the horizontal asymptote. For , the asymptote is . After shifting down by 1, the new asymptote is .
Sketch the graph using these features: the -intercept, the asymptote, and the general exponential growth shape.
Try solving on your own before revealing the answer!
Final Answer:
The correct graph is the one that shows an exponential curve shifted down by 1 unit, with a horizontal asymptote at and passing through .
This matches image_6 above.
