 Back
BackGuided Practice: Reading Values from a Function's Graph
Study Guide - Smart Notes
 Tailored notes based on your materials, expanded with key definitions, examples, and context.
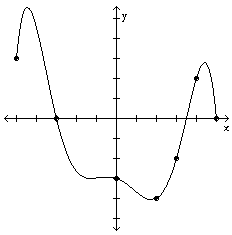
Q1. Use the graph of f given below to find f(4).
Background
Topic: Evaluating Functions from Graphs
This question tests your ability to read and interpret the value of a function at a specific input (x-value) using its graph. This is a foundational skill in calculus, as it helps you understand how functions behave visually and numerically.
Key Terms:
Function: A relation that assigns exactly one output (y-value) for each input (x-value).
Graph of a function: A visual representation showing how the function's output changes with its input.
f(4): The value of the function f when x = 4; this is found by locating x = 4 on the x-axis and reading the corresponding y-value.
Step-by-Step Guidance
Locate the x-value of 4 on the horizontal axis (x-axis) of the graph.
Find the point on the graph where x = 4. This is usually marked with a dot or by following the curve to the vertical line x = 4.
From this point, move horizontally to the y-axis or read the y-coordinate directly from the graph. This y-value represents f(4).
Check if the point is clearly labeled or if you need to estimate the y-value based on the graph's scale.
Try solving on your own before revealing the answer!
Final Answer: f(4) = 2
By locating x = 4 on the graph and reading the corresponding y-value, you find that f(4) is 2.
This demonstrates how to use a graph to evaluate a function at a specific input.
