 Back
BackGuided Study: Limits and Average Rate of Change (Calculus I)
Study Guide - Smart Notes
 Tailored notes based on your materials, expanded with key definitions, examples, and context.
Q1. Find the average rate of change of the function over the given interval.
Background
Topic: Average Rate of Change
This question tests your understanding of how to compute the average rate of change (AROC) of a function over a specified interval. This is a foundational concept in calculus, closely related to the concept of the derivative.
Key formula:
The average rate of change of from to is:
Identify the function and the interval given in each part.
Calculate and by substituting the values into the function.
Subtract from to find the change in function values.
Subtract from to find the change in values.
Set up the AROC formula with your computed values, but do not simplify yet.
Try solving on your own before revealing the answer!
Q2. A rock is launched vertically upward from the ground with a speed of 85 ft/sec. The position after seconds is . Find the average rate of change of the rock between 1 and 3 seconds.
Background
Topic: Average Rate of Change for Motion
This question applies the average rate of change formula to a position function, which in physics represents the average velocity over a time interval.
Key formula:
Identify and .
Compute and using the given position function.
Subtract from to find the change in position.
Subtract from to find the change in time.
Set up the average velocity formula with your computed values, but do not simplify yet.
Try solving on your own before revealing the answer!
Q3. Evaluate the following limits using the graph of given below.
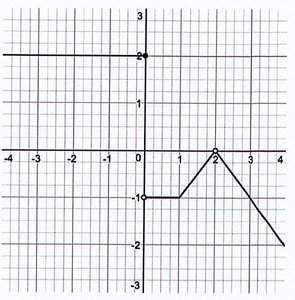
(a)
(b)
(c)
Background
Topic: Limits from a Graph
This question tests your ability to read a graph and determine the value that approaches as approaches a specific value. Remember, the limit depends on the behavior of the function as you approach the point from both sides, not necessarily the value at the point.
Key Terms:
Limit: The value that approaches as approaches a certain value.
Two-sided limit: The value approached from both the left and right sides.
For each part, locate the -value on the graph.
Observe the -values that approaches as gets close to the target value from both sides.
If the left and right approaches agree, that is the limit. If not, the limit does not exist (DNE).
Do not state the final limit value yet; just describe the process.
Try solving on your own before revealing the answer!
Q4. For the graph of given below, find the following values, if they exist. If it does not exist, write "DNE".
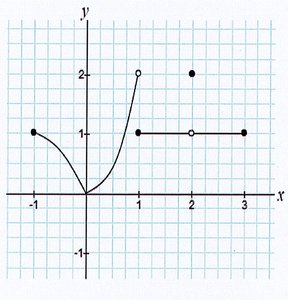
(a)
(b)
(c)
(d)
(e)
(f)
(g)
(h)
Background
Topic: One-Sided and Two-Sided Limits, Function Values from a Graph
This question asks you to distinguish between the value of the function at a point and the values the function approaches from the left and right (one-sided limits), as well as the overall (two-sided) limit.
Key Terms:
One-sided limit: (from the left), (from the right)
Two-sided limit: exists only if both one-sided limits exist and are equal
Function value: is the actual value at (may be different from the limit)
For each part, locate the relevant -value on the graph.
For function values, look for a filled dot at the -value; for open circles, the function is not defined there.
For one-sided limits, trace the graph as approaches the value from the left or right and note the -value approached.
For the two-sided limit, check if the left and right limits agree.
Do not state the final values yet; just describe the process.
Try solving on your own before revealing the answer!
Q5. For the graph of given below, find the following values, if they exist. If it does not exist, write "DNE".
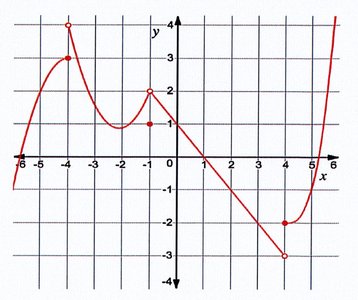
(a)
(b)
(c)
(d)
(e)
(f)
(g)
(h)
(i)
(j)
(k)
(l)
Background
Topic: One-Sided and Two-Sided Limits, Function Values from a Graph
This question is similar to Q4, but with a different graph. It tests your ability to interpret function values and limits at various points, including where the function may be discontinuous or undefined.
Key Terms:
See Q4 for definitions of one-sided limits, two-sided limits, and function values.
For each part, locate the relevant -value on the graph.
For function values, look for a filled dot at the -value; for open circles, the function is not defined there.
For one-sided limits, trace the graph as approaches the value from the left or right and note the -value approached.
For the two-sided limit, check if the left and right limits agree.
Do not state the final values yet; just describe the process.
Try solving on your own before revealing the answer!
Q6. Here are the graphs of the functions and . Compute the values indicated below.
Background
Topic: Limits and Function Values from Graphs, Limits of Quotients
This question asks you to evaluate function values and limits, including limits of quotients, using the graphs of and . For limits involving quotients, recall that if both limits exist and the denominator is not zero.
Key Terms and Formulas:
Limit of a quotient: (if denominator limit is not zero)
For each part, use the graphs to find the required function value or limit.
For quotient limits, check that the denominator's limit is not zero before dividing.
Set up the expressions for each part, but do not compute the final values yet.
Try solving on your own before revealing the answer!
