 Back
BackLimits and Continuity from a Graph – Step-by-Step Guidance
Study Guide - Smart Notes
 Tailored notes based on your materials, expanded with key definitions, examples, and context.
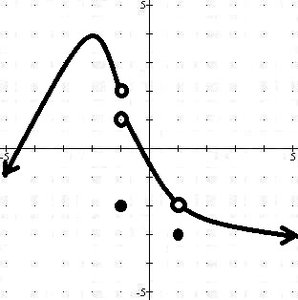
Q1. Evaluate the following limits using the graph of :
List all values of at which has a discontinuity.
Background
Topic: Limits and Continuity from a Graph
These questions test your ability to interpret a graph to determine left-hand and right-hand limits, function values, and points of discontinuity. Understanding how to read open and closed circles, as well as jumps or holes in the graph, is essential for these types of problems.
Key Terms and Concepts:
Left-hand limit (): The value approaches as approaches from the left.
Right-hand limit (): The value approaches as approaches from the right.
Limit (): Exists only if both left- and right-hand limits exist and are equal.
Function value (): The actual value of the function at (look for a filled dot).
Discontinuity: A point where the function is not continuous (jump, hole, or asymptote).
Step-by-Step Guidance
For each limit, identify whether you are approaching from the left (), right (), or both sides (). On the graph, trace the curve as gets close to the target value from the specified direction.
Look for open circles (indicating a value the function does not take) and closed circles (indicating the actual value of the function at that point). The limit depends on the -value the graph approaches, not necessarily the value of .
If the left-hand and right-hand limits are not equal, the two-sided limit does not exist (DNE).
For function values like , find the filled dot at and read its -value. If there is no filled dot, $f(a)$ is undefined.
To find discontinuities, look for jumps, holes (open circles), or places where the function is not defined. List all -values where these occur.
Try solving on your own before revealing the answer!
