 Back
BackPiecewise Functions: Sketching and Interpretation
Study Guide - Smart Notes
 Tailored notes based on your materials, expanded with key definitions, examples, and context.
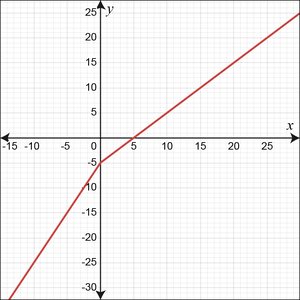
Q2. Sketch the graph of the following piecewise function:
Background
Topic: Piecewise Functions
This question tests your understanding of how to interpret and graph piecewise-defined functions. Piecewise functions are defined by different expressions depending on the value of the input variable, and their graphs often have distinct segments or behaviors at certain points.
Key Terms and Formulas:
Piecewise Function: A function defined by multiple sub-functions, each applying to a certain interval of the domain.
Linear Function: A function of the form , where is the slope and is the y-intercept.
Graphing: Plot each segment according to its formula and domain, paying attention to endpoints and possible discontinuities.
Step-by-Step Guidance
Identify the two cases for : For , use . For , use .
For , plot the line . This is a straight line with slope 2 and y-intercept -5. Make sure to only plot this for .
For , plot the line . This is a straight line with slope -1 and y-intercept -5. Only plot this for .
Check the value at for both pieces: (for ). For , the function does not include , so the graph may have a sharp corner or change in slope at $x = 0$.
Look for any discontinuity or sharp change at by comparing the left and right limits at .
Try solving on your own before revealing the answer!
Final Answer:
The correct graph is option (a), which shows the two linear segments meeting at with a sharp corner at .
This matches the behavior of the piecewise function, with the left segment () having slope 2 and the right segment () having slope -1.
