 Back
BackStudy Guide: Limits and Continuity (Calculus)
Study Guide - Smart Notes
 Tailored notes based on your materials, expanded with key definitions, examples, and context.
Q1. What is a limit? Find the limit numerically and graphically for a given function.
Background
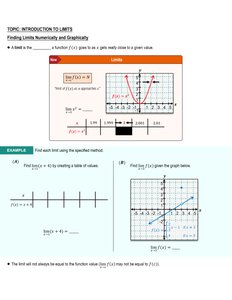
Topic: Introduction to Limits
This question tests your understanding of the concept of a limit and how to estimate limits using tables of values and graphs.
Key Terms and Formulas:
Limit: The value that a function approaches as the input approaches a certain point.
Notation:
Step-by-Step Guidance
Identify the point where you are finding the limit .
Create a table of values for as gets closer to from both sides (left and right).
Observe the values in the table to see what approaches as gets close to .
Look at the graph of and visually estimate the value the function approaches as nears .
Try solving on your own before revealing the answer!
Q2. Find each limit using a table of values.
Background
Topic: Numerical Estimation of Limits
This question asks you to estimate limits by creating a table of values for the function as approaches a specific value.
Key Terms and Formulas:
Table of values: List values close to the target and compute for each.
Limit notation:
Step-by-Step Guidance
Choose values of that are close to the target value from both sides.
Calculate for each chosen value.
Observe the trend in as gets closer to .

Try solving on your own before revealing the answer!
Q3. Find each limit using the graph of shown.
Background
Topic: Graphical Estimation of Limits
This question tests your ability to estimate limits by analyzing the graph of a function.
Key Terms and Formulas:
Graph of : Visual representation of the function.
Limit:
Step-by-Step Guidance
Locate the point on the graph.
Observe the behavior of as approaches from both sides.
Estimate the value that approaches near .
Try solving on your own before revealing the answer!
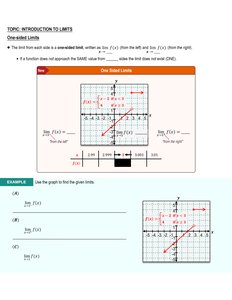
Q4. Find one-sided limits using the graph.
Background
Topic: One-Sided Limits
This question tests your understanding of left-hand and right-hand limits using a graph.
Key Terms and Formulas:
Left-hand limit:
Right-hand limit:
Step-by-Step Guidance
Identify the point on the graph.
Observe the value approaches as comes from the left ().
Observe the value approaches as comes from the right ().
Try solving on your own before revealing the answer!
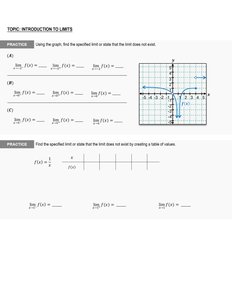
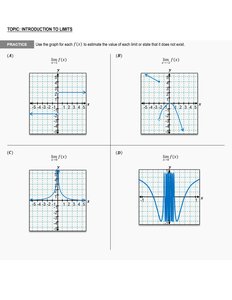
Q5. Find the specified limit or state that the limit does not exist using the graph.
Background
Topic: Existence of Limits
This question asks you to determine whether a limit exists at a given point using the graph.
Key Terms and Formulas:
Limit exists if left and right limits are equal.
Notation:
Step-by-Step Guidance
Check the graph at to see if approaches the same value from both sides.
If the values are different or the function is unbounded/oscillating, the limit does not exist.
State your reasoning based on the graph's behavior.
Try solving on your own before revealing the answer!
Q6. Find the specified limit or state that the limit does not exist by creating a table of values.
Background
Topic: Numerical Estimation and Existence of Limits
This question tests your ability to use a table of values to determine if a limit exists.
Key Terms and Formulas:
Table of values: List values near the target and compute .
Limit notation:
Step-by-Step Guidance
Choose values of close to from both sides.
Calculate for each value.
Observe if approaches a single value or not.
Try solving on your own before revealing the answer!
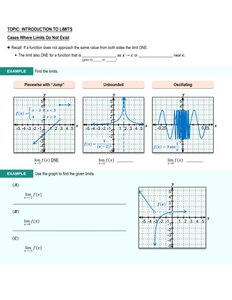
Q7. Cases where limits do not exist: Piecewise, Unbounded, Oscillating
Background
Topic: Non-Existence of Limits
This question explores situations where limits fail to exist, such as jump discontinuities, unbounded behavior, or oscillation.
Key Terms and Formulas:
Piecewise: Function has different values from left and right.
Unbounded: Function goes to infinity.
Oscillating: Function does not settle to a single value.
Step-by-Step Guidance
Identify the type of discontinuity (jump, unbounded, oscillating) from the graph.
Explain why the limit does not exist in each case.
Use the graph to illustrate the behavior near the point of interest.
Try solving on your own before revealing the answer!
Q8. Estimate the value of each limit or state that it does not exist using the graph.
Background
Topic: Estimating Limits from Graphs
This question asks you to use the graph to estimate the value of a limit or determine if it does not exist.
Key Terms and Formulas:
Limit estimation:
Existence criteria: Left and right limits must be equal.
Step-by-Step Guidance
Examine the graph near .
Estimate the value approaches as nears .
If the graph shows a jump, unbounded, or oscillating behavior, state that the limit does not exist.
Try solving on your own before revealing the answer!
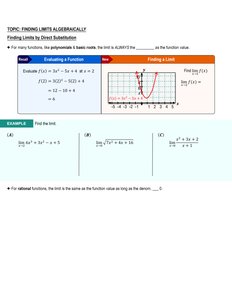
Q9. Find limits algebraically by direct substitution.
Background
Topic: Algebraic Evaluation of Limits
This question tests your ability to find limits by substituting the value directly into the function.
Key Terms and Formulas:
Direct substitution: Plug into .
Limit notation:
Step-by-Step Guidance
Check if the function is defined at .
Substitute into .
If the function is continuous at , the limit equals .
Try solving on your own before revealing the answer!
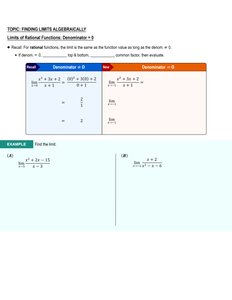
Q10. Find limits of rational functions when the denominator is zero.
Background
Topic: Limits of Rational Functions
This question tests your ability to handle limits where the denominator becomes zero, often requiring simplification.
Key Terms and Formulas:
Factor numerator and denominator.
Cancel common factors if possible.
Limit notation:
Step-by-Step Guidance
Factor both numerator and denominator.
Cancel any common factors.
Substitute into the simplified function.
Try solving on your own before revealing the answer!
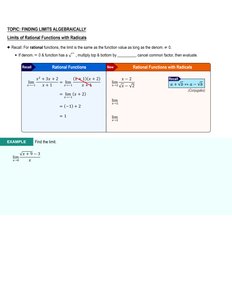
Q11. Find limits of rational functions with radicals.
Background
Topic: Limits Involving Radicals
This question tests your ability to find limits when the function contains a radical, often requiring rationalization.
Key Terms and Formulas:
Rationalize numerator or denominator if substitution gives indeterminate form.
Limit notation:
Step-by-Step Guidance
Try direct substitution first.
If you get , multiply numerator and denominator by the conjugate.
Simplify and substitute again.
Try solving on your own before revealing the answer!
Q12. Determine if a function is continuous at a given value using the graph.
Background
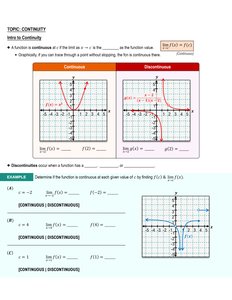
Topic: Continuity
This question tests your understanding of continuity at a point using the graph of a function.
Key Terms and Formulas:
Continuous at if .
Discontinuous if there is a jump, hole, or asymptote at .
Step-by-Step Guidance
Check if is defined.
Check if exists.
Check if .
Try solving on your own before revealing the answer!
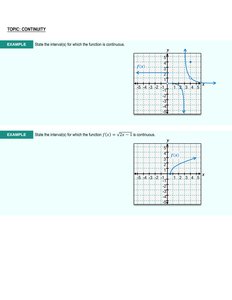
Q13. State the interval(s) for which the function is continuous.
Background
Topic: Intervals of Continuity
This question asks you to identify intervals where the function is continuous based on its graph.
Key Terms and Formulas:
Continuous interval: Where the graph has no breaks, jumps, or holes.
Notation: Interval notation (e.g., )
Step-by-Step Guidance
Examine the graph for any discontinuities (jumps, holes, asymptotes).
Identify the regions where the function is unbroken.
Write the intervals using proper notation.
Try solving on your own before revealing the answer!
