In Exercises 39–45, graph each inequality. y ≤ x^2 - 1
Verified step by step guidance
1
Step 1: Start by identifying the inequality. The given inequality is y ≤ x² - 1. This represents a parabola that opens upwards because the coefficient of x² is positive. The inequality symbol '≤' indicates that the region includes the parabola itself and the area below it.
Step 2: Rewrite the inequality as an equation to find the boundary curve. The equation is y = x² - 1. This is the equation of a parabola with its vertex at (0, -1) and its axis of symmetry along the y-axis.
Step 3: Plot the parabola y = x² - 1. To do this, create a table of values by substituting different x-values into the equation to find corresponding y-values. For example, if x = -2, y = (-2)² - 1 = 3. Plot points such as (-2, 3), (-1, 0), (0, -1), (1, 0), and (2, 3), and then draw a smooth curve through these points.
Step 4: Since the inequality is '≤', shade the region below the parabola, including the parabola itself. This indicates that all points (x, y) in this region satisfy the inequality y ≤ x² - 1.
Step 5: Finally, double-check your graph to ensure that the parabola is correctly plotted and the shading accurately represents the solution set. Label the graph clearly to indicate the inequality y ≤ x² - 1.
Verified video answer for a similar problem:
This video solution was recommended by our tutors as helpful for the problem above
Video duration:
5m
Play a video:
0 Comments
Key Concepts
Here are the essential concepts you must grasp in order to answer the question correctly.
Inequalities
Inequalities express a relationship where one quantity is not equal to another, often using symbols like ≤, ≥, <, or >. In this case, the inequality y ≤ x^2 - 1 indicates that the value of y is less than or equal to the value of the quadratic function x^2 - 1. Understanding how to interpret and graph inequalities is crucial for visualizing the solution set.
A quadratic function is a polynomial function of degree two, typically expressed in the form f(x) = ax^2 + bx + c. The graph of a quadratic function is a parabola, which can open upwards or downwards depending on the sign of the coefficient 'a'. In the given inequality, the function x^2 - 1 represents a parabola that opens upwards and is shifted down by one unit.
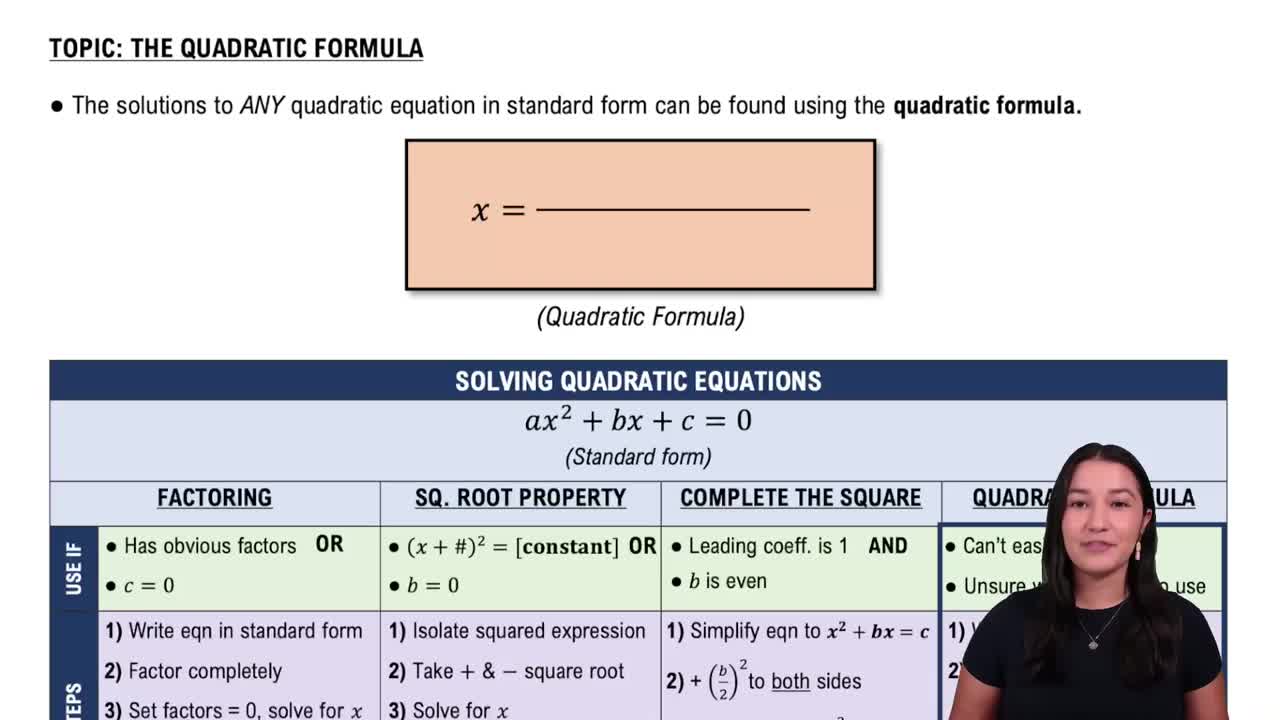
Solving Quadratic Equations Using The Quadratic Formula
Graphing Techniques
Graphing techniques involve plotting points and understanding the shape of functions to visualize their behavior. For the inequality y ≤ x^2 - 1, one must first graph the boundary line y = x^2 - 1, then shade the region below this curve to represent all points where y is less than or equal to the quadratic function. Mastery of these techniques is essential for accurately representing inequalities on a coordinate plane.

 Verified step by step guidance
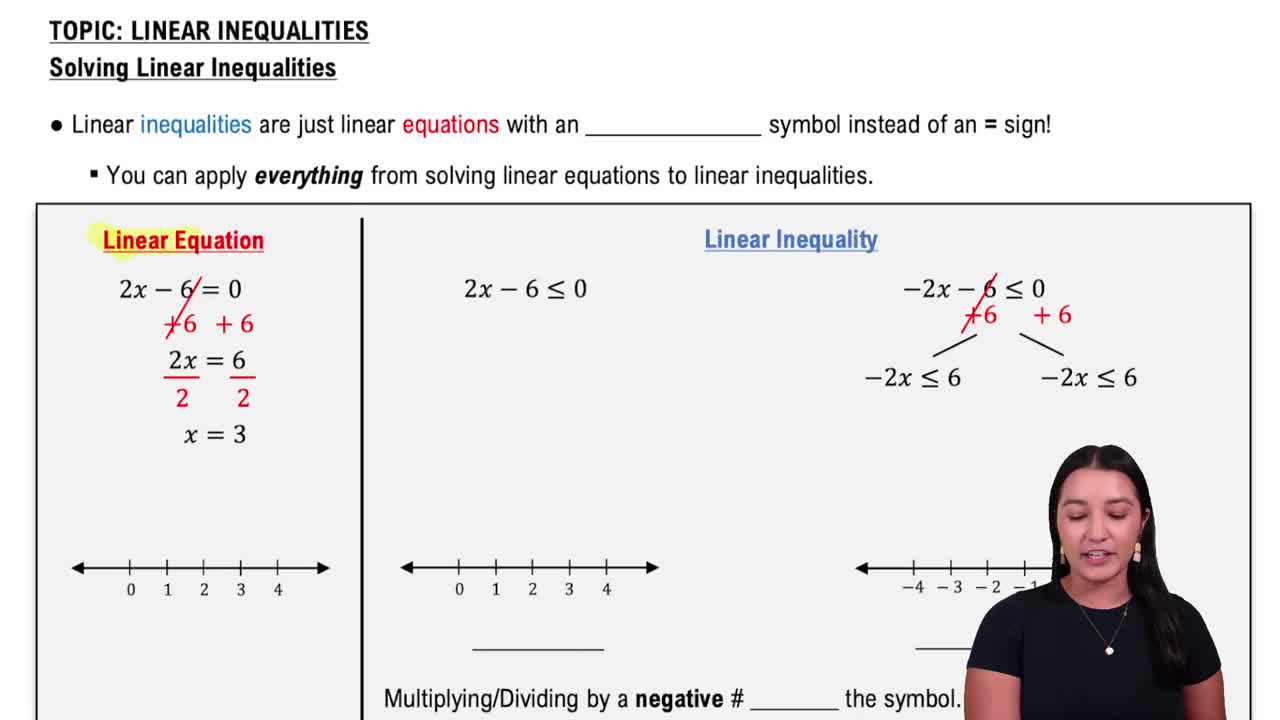
 06:07
06:07