In Exercises 39–45, graph each inequality. y ≤ 2^x
Verified step by step guidance
1
Step 1: Understand the inequality. The given inequality is y ≤ 2^x. This means that the graph will include all points where the y-value is less than or equal to the value of 2 raised to the power of x. The boundary of this inequality is the equation y = 2^x.
Step 2: Graph the boundary equation y = 2^x. Start by plotting key points for the equation y = 2^x. For example, calculate values for x = -2, -1, 0, 1, and 2. The corresponding y-values will be y = 2^(-2), y = 2^(-1), y = 2^0, y = 2^1, and y = 2^2. Plot these points on a coordinate plane.
Step 3: Draw the curve for y = 2^x. Connect the points you plotted in Step 2 with a smooth curve. This curve represents the boundary of the inequality. Since the inequality is 'less than or equal to,' the curve itself is included in the solution set, so it should be drawn as a solid line.
Step 4: Shade the region below the curve. The inequality y ≤ 2^x means that the solution includes all points where the y-value is less than or equal to the value of 2^x. To represent this, shade the region below the curve on the graph.
Step 5: Verify the solution. Pick a test point in the shaded region (e.g., (0, 0)) and substitute it into the inequality y ≤ 2^x. If the inequality holds true, the shading is correct. If not, adjust the shading accordingly.
Verified video answer for a similar problem:
This video solution was recommended by our tutors as helpful for the problem above
Video duration:
5m
Play a video:
0 Comments
Key Concepts
Here are the essential concepts you must grasp in order to answer the question correctly.
Inequalities
Inequalities are mathematical expressions that show the relationship between two values when they are not equal. They use symbols such as ≤ (less than or equal to), ≥ (greater than or equal to), < (less than), and > (greater than). Understanding how to interpret and graph inequalities is essential for visualizing the solution set of an inequality on a coordinate plane.
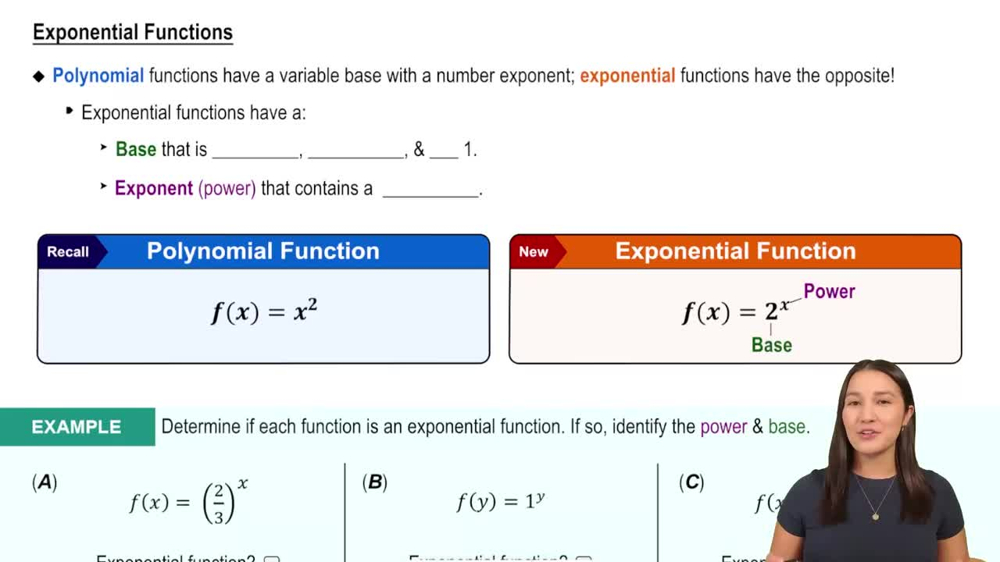
Exponential functions are mathematical functions of the form f(x) = a * b^x, where 'a' is a constant, 'b' is a positive base, and 'x' is the exponent. In the given inequality, y ≤ 2^x, the function represents exponential growth, where the value of y increases rapidly as x increases. Recognizing the characteristics of exponential functions helps in understanding their graphs and behavior.
Graphing techniques involve plotting points on a coordinate plane to represent mathematical relationships visually. For inequalities, this includes shading the region that satisfies the inequality. In the case of y ≤ 2^x, the graph of the function y = 2^x is drawn, and the area below this curve is shaded to indicate all the points where y is less than or equal to 2^x, illustrating the solution set.

 Verified step by step guidance
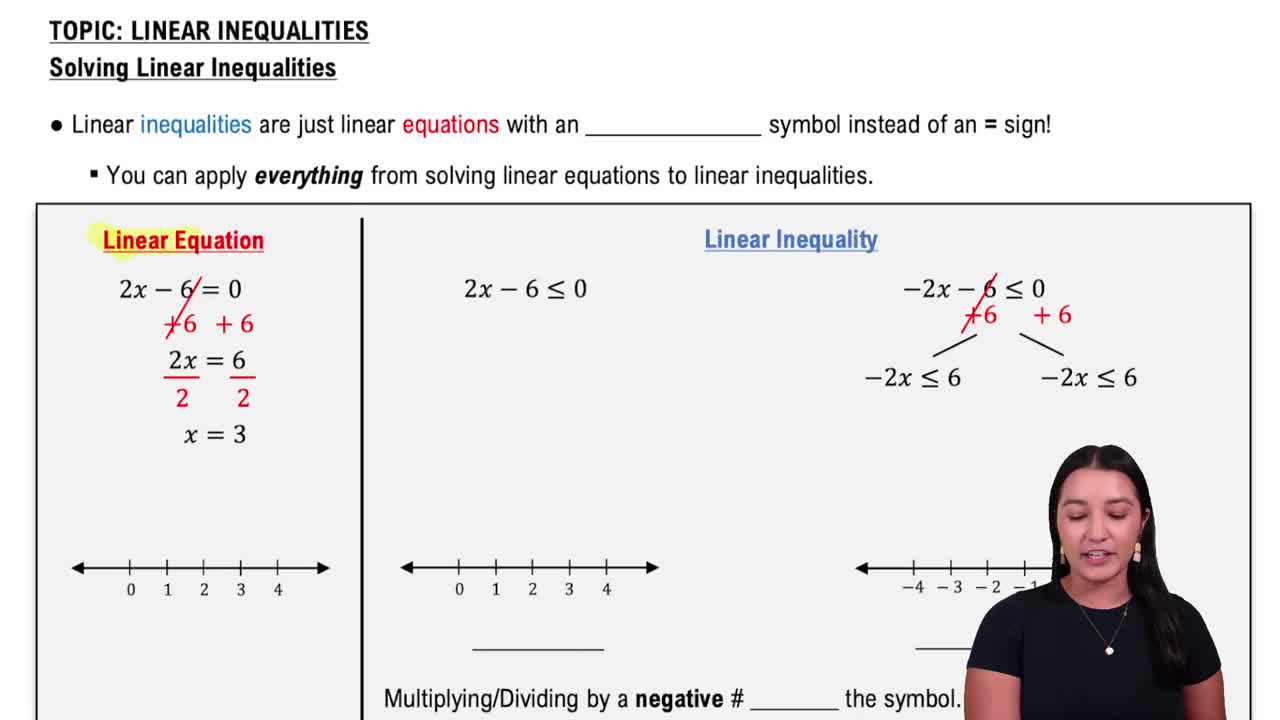
 06:07
06:07