Recognize that the inequality \(x^{2} + y^{2} \leq 1\) represents all points \((x, y)\) whose distance from the origin is less than or equal to 1. This describes a circle centered at the origin with radius 1, including the interior.
Rewrite the inequality as \(x^{2} + y^{2} \leq 1\) to emphasize that the boundary is the circle \(x^{2} + y^{2} = 1\).
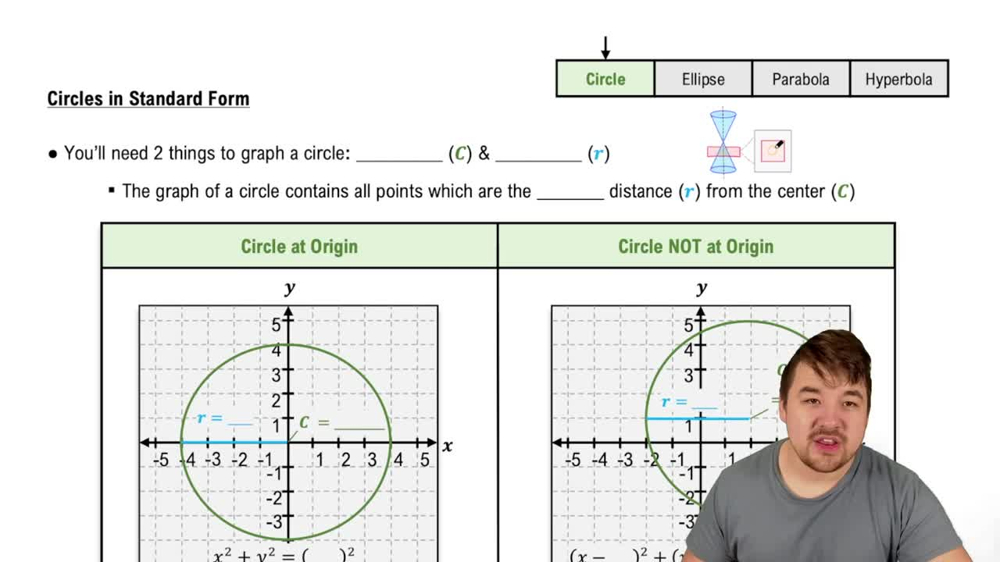
Graph the boundary circle by plotting points that satisfy \(x^{2} + y^{2} = 1\). For example, points \((1,0)\), \((-1,0)\), \((0,1)\), and \((0,-1)\) lie on the circle.
Since the inequality is \(\leq\) (less than or equal to), shade the entire region inside the circle, including the boundary, to represent all points where \(x^{2} + y^{2} \leq 1\).
Optionally, test a point inside the circle, such as \((0,0)\), by substituting into the inequality to confirm it satisfies \(x^{2} + y^{2} \leq 1\), ensuring the shading is correct.
Verified video answer for a similar problem:
This video solution was recommended by our tutors as helpful for the problem above
Video duration:
5m
Play a video:
0 Comments
Key Concepts
Here are the essential concepts you must grasp in order to answer the question correctly.
Graphing Inequalities
Graphing inequalities involves shading the region of the coordinate plane that satisfies the inequality. For example, for an inequality like x² + y² ≤ 1, you graph the boundary curve first, then shade the area where the inequality holds true, including points on the boundary if the inequality is ≤ or ≥.
The equation x² + y² = 1 represents a circle centered at the origin (0,0) with radius 1. Understanding this helps in graphing the boundary of the inequality, as the circle defines the limit of the region to be shaded.
Inequalities with ≤ or ≥ include the boundary curve, meaning the region is closed and the boundary is part of the solution set. In contrast, < or > inequalities exclude the boundary, resulting in an open region. This distinction affects how the graph is drawn.

 Verified step by step guidance
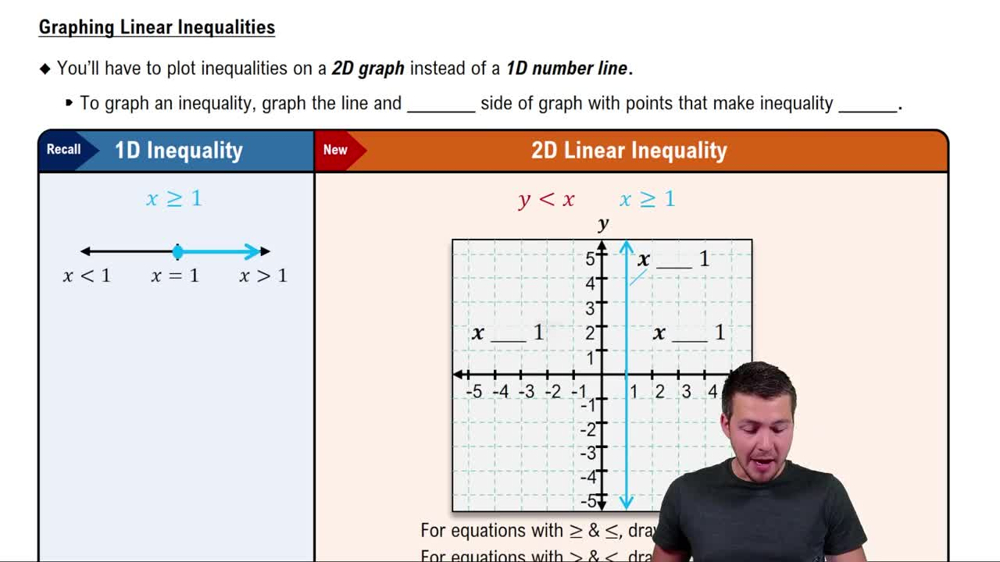
 7:02
7:02