Identify the inequality given: \(y > -3\). This means we are looking for all points where the y-coordinate is greater than -3.
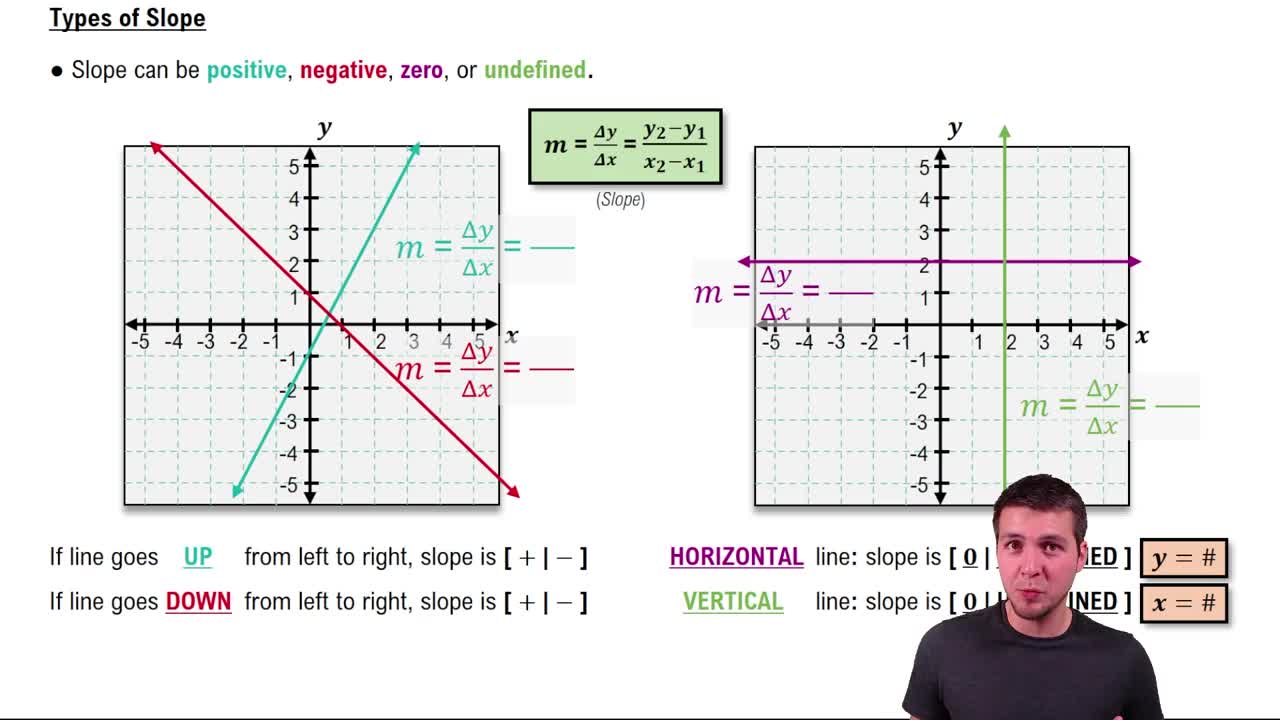
Graph the boundary line \(y = -3\). Since the inequality is strict (greater than, not greater than or equal to), draw this line as a dashed horizontal line to indicate that points on the line are not included.
Determine which side of the line to shade. Since the inequality is \(y > -3\), shade the region above the line \(y = -3\) because those points have y-values greater than -3.
Check a test point not on the boundary line to confirm the shading. For example, use the point \((0,0)\): since \$0 > -3\( is true, the region containing \)(0,0)$ should be shaded.
Label the graph clearly with the dashed line at \(y = -3\) and the shaded region above it to represent all solutions to the inequality \(y > -3\).
Verified video answer for a similar problem:
This video solution was recommended by our tutors as helpful for the problem above
Video duration:
3m
Play a video:
0 Comments
Key Concepts
Here are the essential concepts you must grasp in order to answer the question correctly.
Graphing Linear Inequalities
Graphing linear inequalities involves shading a region of the coordinate plane that satisfies the inequality. For an inequality like y > -3, you first graph the boundary line y = -3, then determine which side of the line to shade based on the inequality symbol.
The boundary line for an inequality is drawn as either solid or dashed. A solid line is used for ≤ or ≥ inequalities, indicating points on the line are included. A dashed line is used for < or > inequalities, indicating points on the line are not included in the solution.
To decide which side of the boundary line to shade, select a test point not on the line (often (0,0)) and substitute it into the inequality. If the inequality holds true, shade the side containing the test point; otherwise, shade the opposite side.

 Verified step by step guidance
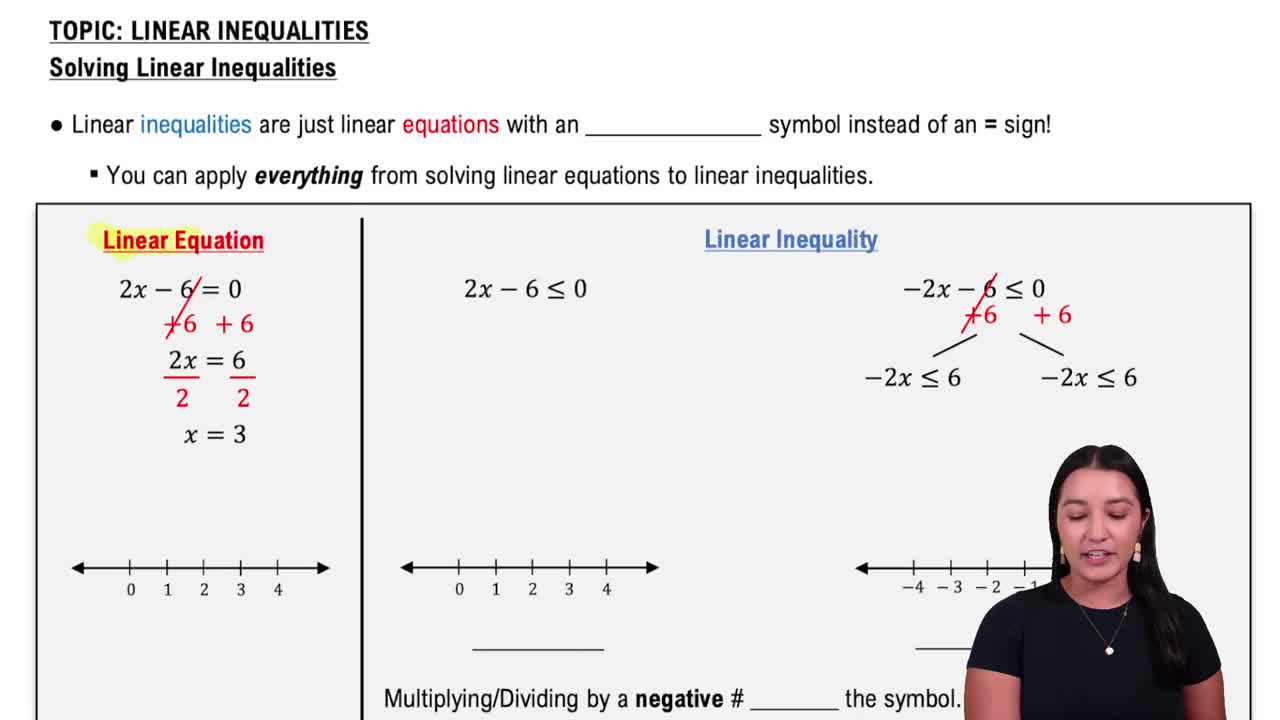
 06:07
06:07