Determine whether each equation defines y as a function of x. 2x + y^2 = 6
Table of contents
- 0. Review of Algebra4h 18m
- 1. Equations & Inequalities3h 18m
- 2. Graphs of Equations1h 43m
- 3. Functions2h 17m
- 4. Polynomial Functions1h 44m
- 5. Rational Functions1h 23m
- 6. Exponential & Logarithmic Functions2h 28m
- 7. Systems of Equations & Matrices4h 5m
- 8. Conic Sections2h 23m
- 9. Sequences, Series, & Induction1h 22m
- 10. Combinatorics & Probability1h 45m
2. Graphs of Equations
Graphs and Coordinates
Problem 31
Textbook Question
In Exercises 31–32, the domain of each piecewise function is (-∞, ∞) (a) Graph each function. (b) Use the graph to determine the function's range.
 Verified step by step guidance
1
Understand the problem: A piecewise function is defined by different expressions depending on the input value (x). The domain is given as (-∞, ∞), meaning the function is defined for all real numbers. We need to graph the function and determine its range based on the graph.
Step 1: Identify the pieces of the piecewise function. For each piece, note the expression and the interval of x-values where it applies. For example, if the function is defined as f(x) = x^2 for x < 0 and f(x) = x + 1 for x ≥ 0, these are the two pieces to graph.
Step 2: Graph each piece of the function separately. For each piece, plot points by substituting x-values into the corresponding expression. Be mindful of whether the endpoints of the intervals are included (closed circle) or excluded (open circle).
Step 3: Combine the graphs of all pieces into a single graph. Ensure the transitions between pieces are accurate and consistent with the domain restrictions for each piece.
Step 4: Analyze the graph to determine the range of the function. The range is the set of all y-values that the function takes on. Look at the graph to see the lowest and highest y-values (if any) and whether the function covers all values in between.
 Verified video answer for a similar problem:
This video solution was recommended by our tutors as helpful for the problem above
Video duration:
4mPlay a video:
Key Concepts
Here are the essential concepts you must grasp in order to answer the question correctly.
Piecewise Functions
A piecewise function is defined by multiple sub-functions, each applying to a specific interval of the domain. Understanding how to interpret and graph these functions is crucial, as each piece may have different rules or equations. This concept allows for the representation of functions that change behavior based on the input value.
Recommended video:

Function Composition
Graphing Functions
Graphing functions involves plotting points on a coordinate plane to visualize the relationship between the input (x-values) and output (y-values). For piecewise functions, it is essential to accurately represent each segment according to its defined interval. This visual representation helps in understanding the function's behavior and identifying key features such as continuity and discontinuity.
Recommended video:

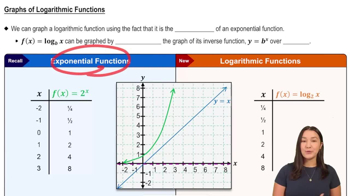
Graphs of Logarithmic Functions
Range of a Function
The range of a function is the set of all possible output values (y-values) that the function can produce. To determine the range from a graph, one must observe the vertical extent of the plotted points. For piecewise functions, the range may vary across different segments, making it important to analyze each piece to find the overall range.
Recommended video:

Domain & Range of Transformed Functions

 5:10m
5:10mWatch next
Master Graphs & the Rectangular Coordinate System with a bite sized video explanation from Patrick
Start learningRelated Videos
Related Practice
Textbook Question
160
views
