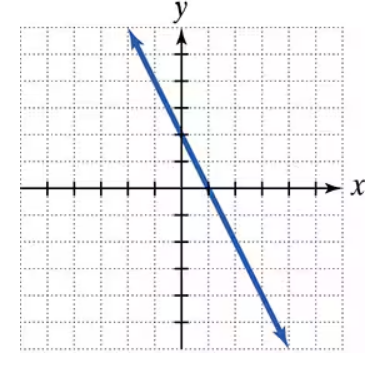
Use the graph to a. determine the x-intercepts, if any; b. determine the y-intercepts, if any. For each graph, tick marks along the axes represent one unit each.
Verified step by step guidance
1
Observe the graph and identify the points where the line intersects the x-axis and y-axis. These are the x-intercept and y-intercept, respectively.
To determine the x-intercept, locate the point where the line crosses the x-axis. On the x-axis, the y-coordinate is always 0. From the graph, the line intersects the x-axis at x = 3.
To determine the y-intercept, locate the point where the line crosses the y-axis. On the y-axis, the x-coordinate is always 0. From the graph, the line intersects the y-axis at y = 7.
Summarize the intercepts: The x-intercept is the point (3, 0), and the y-intercept is the point (0, 7).
Verify the intercepts by checking the graph again to ensure the points align with the tick marks and the line's trajectory.
Verified video answer for a similar problem:
This video solution was recommended by our tutors as helpful for the problem above
Video duration:
54s
Play a video:
0 Comments
Key Concepts
Here are the essential concepts you must grasp in order to answer the question correctly.
X-Intercept
The x-intercept of a graph is the point where the graph intersects the x-axis. At this point, the value of y is zero. To find the x-intercept, you can set the equation of the graph to zero and solve for x. In the provided graph, the x-intercept is at (3, 0).
The y-intercept of a graph is the point where the graph intersects the y-axis. At this point, the value of x is zero. To determine the y-intercept, set the equation of the graph to zero and solve for y. In the given graph, the y-intercept is at (0, 7).
Interpreting a graph involves understanding the relationship between the variables represented on the axes. The x-axis typically represents the independent variable, while the y-axis represents the dependent variable. Analyzing the graph allows you to identify key features such as intercepts, slopes, and overall trends, which are essential for solving related algebraic problems.

 Verified step by step guidance
 04:08
04:08