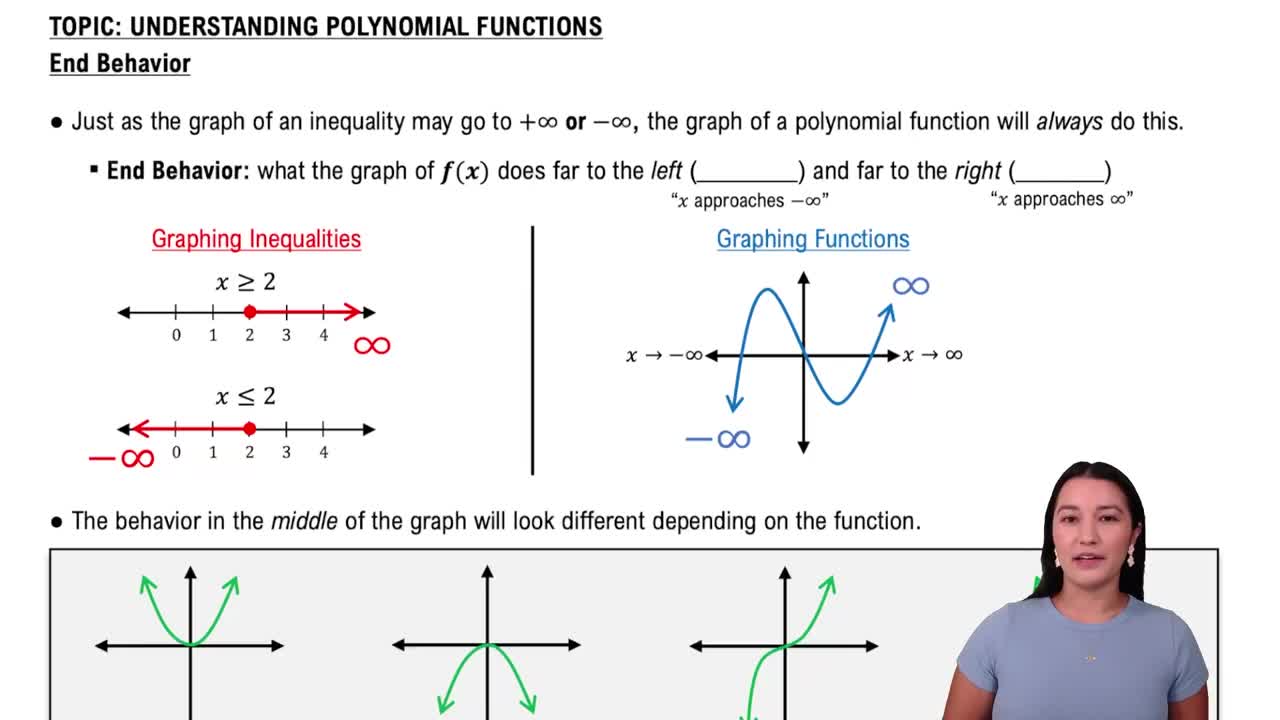
Use an end behavior diagram, as shown below, to describe the end behavior of the graph of each polynomial function. ƒ(x)=-x3-4x2+2x-1
Verified step by step guidance
1
Identify the leading term of the polynomial function. For the function \(f(x) = -x^3 - 4x^2 + 2x - 1\), the leading term is \(-x^3\) because it has the highest power of \(x\).
Determine the degree of the polynomial and the sign of the leading coefficient. Here, the degree is 3 (an odd number), and the leading coefficient is \(-1\) (negative).
Recall the general end behavior for polynomials based on degree and leading coefficient: For an odd degree with a negative leading coefficient, as \(x \to \infty\), \(f(x) \to -\infty\), and as \(x \to -\infty\), \(f(x) \to \infty\).
Use this information to describe the end behavior diagram: The graph falls to the right (because \(f(x) \to -\infty\) as \(x \to \infty\)) and rises to the left (because \(f(x) \to \infty\) as \(x \to -\infty\)).
Summarize the end behavior using symbols or words, such as: As \(x \to \infty\), \(f(x) \to -\infty\); as \(x \to -\infty\), \(f(x) \to \infty\).
Verified video answer for a similar problem:
This video solution was recommended by our tutors as helpful for the problem above
Video duration:
1m
Play a video:
0 Comments
Key Concepts
Here are the essential concepts you must grasp in order to answer the question correctly.
Polynomial Functions
Polynomial functions are expressions consisting of variables raised to whole-number exponents combined using addition, subtraction, and multiplication. Understanding the degree and leading coefficient of a polynomial is essential to analyze its graph and behavior.
End behavior describes how the values of a polynomial function behave as the input (x) approaches positive or negative infinity. It is primarily determined by the degree and leading coefficient of the polynomial, indicating whether the graph rises or falls at the ends.
The leading coefficient test uses the sign and degree of the leading term to predict the end behavior of a polynomial graph. For example, an odd-degree polynomial with a negative leading coefficient falls to the right and rises to the left, guiding the sketch of the graph.


 Verified step by step guidance
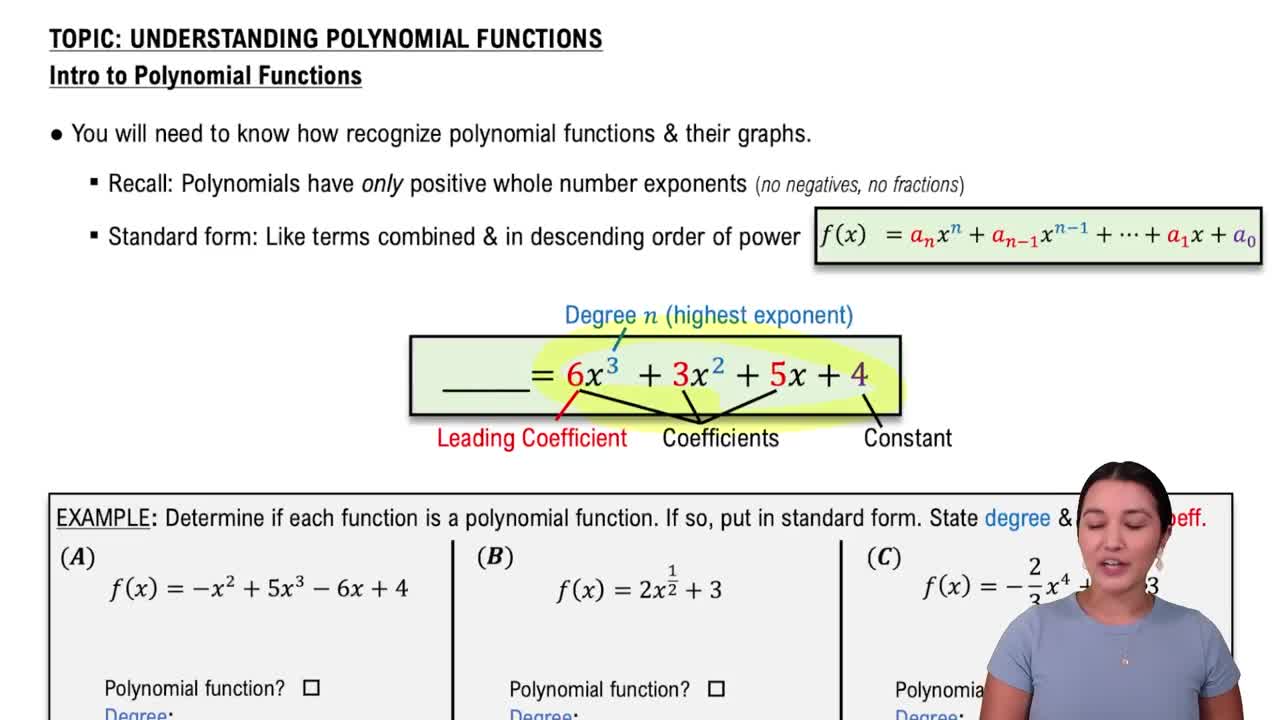
 06:04
06:04