
Textbook Question
Graph each function. Determine the largest open intervals of the domain over which each function is (a) increasing or (b) decreasing. ƒ(x)=(1/3)(x+3)4-3
751
views
 Verified step by step guidanceVerified video answer for a similar problem:
 5:26
5:26 05:18
05:18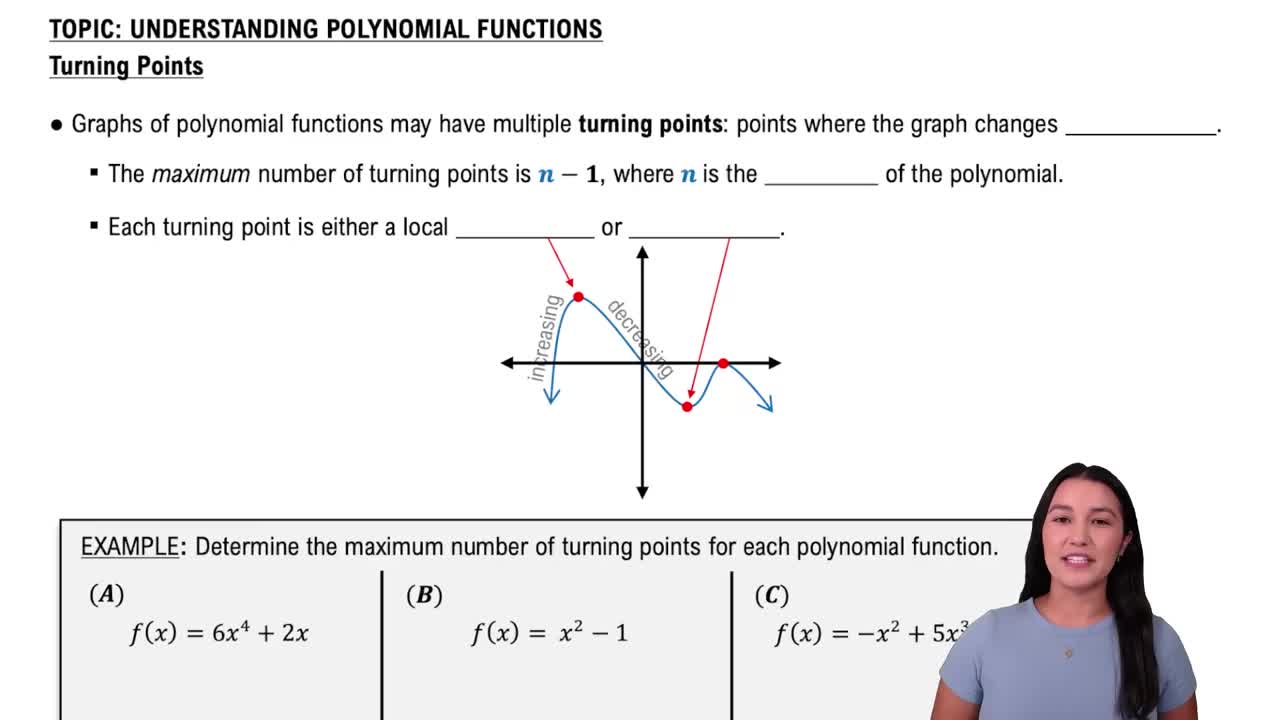 02:44
02:44