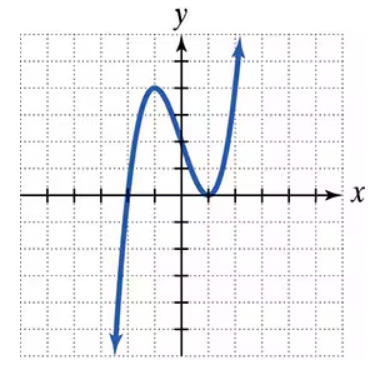
Use the graph to a. determine the x-intercepts, if any; b. determine the y-intercepts, if any. For each graph, tick marks along the axes represent one unit each.
Verified step by step guidance
1
Observe the graph and identify the points where the curve crosses the x-axis. These points are the x-intercepts. The x-intercepts occur when the y-value is 0.
From the graph, locate the x-coordinates of the points where the curve intersects the x-axis. These are the x-intercepts.
Next, identify the point where the curve crosses the y-axis. This point is the y-intercept. The y-intercept occurs when the x-value is 0.
From the graph, locate the y-coordinate of the point where the curve intersects the y-axis. This is the y-intercept.
Summarize the x-intercepts and y-intercept based on the observations from the graph.
Verified video answer for a similar problem:
This video solution was recommended by our tutors as helpful for the problem above
Video duration:
1m
Play a video:
0 Comments
Key Concepts
Here are the essential concepts you must grasp in order to answer the question correctly.
X-Intercepts
X-intercepts are the points where a graph crosses the x-axis. At these points, the value of y is zero. To find the x-intercepts, one can set the function equal to zero and solve for x. In graphical terms, these are the horizontal intersections of the curve with the x-axis.
Y-intercepts are the points where a graph crosses the y-axis, occurring when the value of x is zero. To determine the y-intercept, substitute x = 0 into the function and solve for y. Graphically, these points represent the vertical intersections of the curve with the y-axis.
Graph interpretation involves analyzing the visual representation of a function to extract meaningful information, such as intercepts, trends, and behavior at extremes. Understanding how to read a graph, including the significance of axes and tick marks, is crucial for accurately identifying intercepts and other features of the function.

 Verified step by step guidance
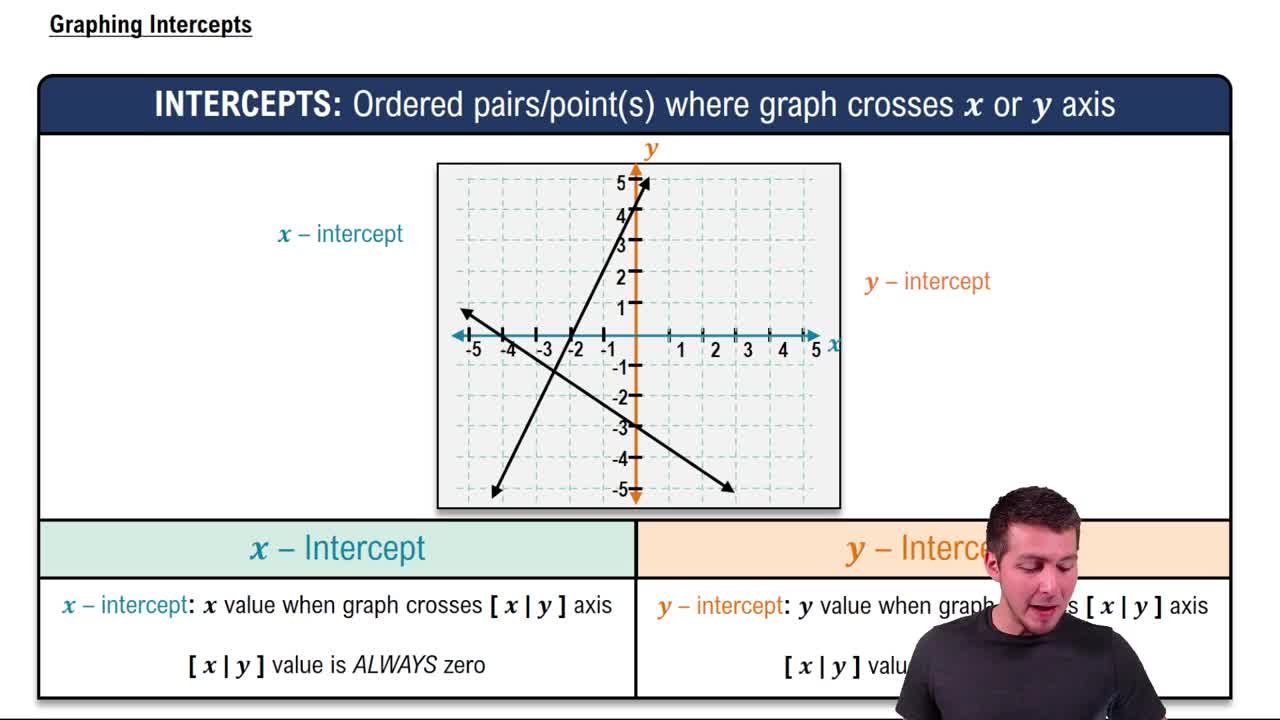
 04:08
04:08