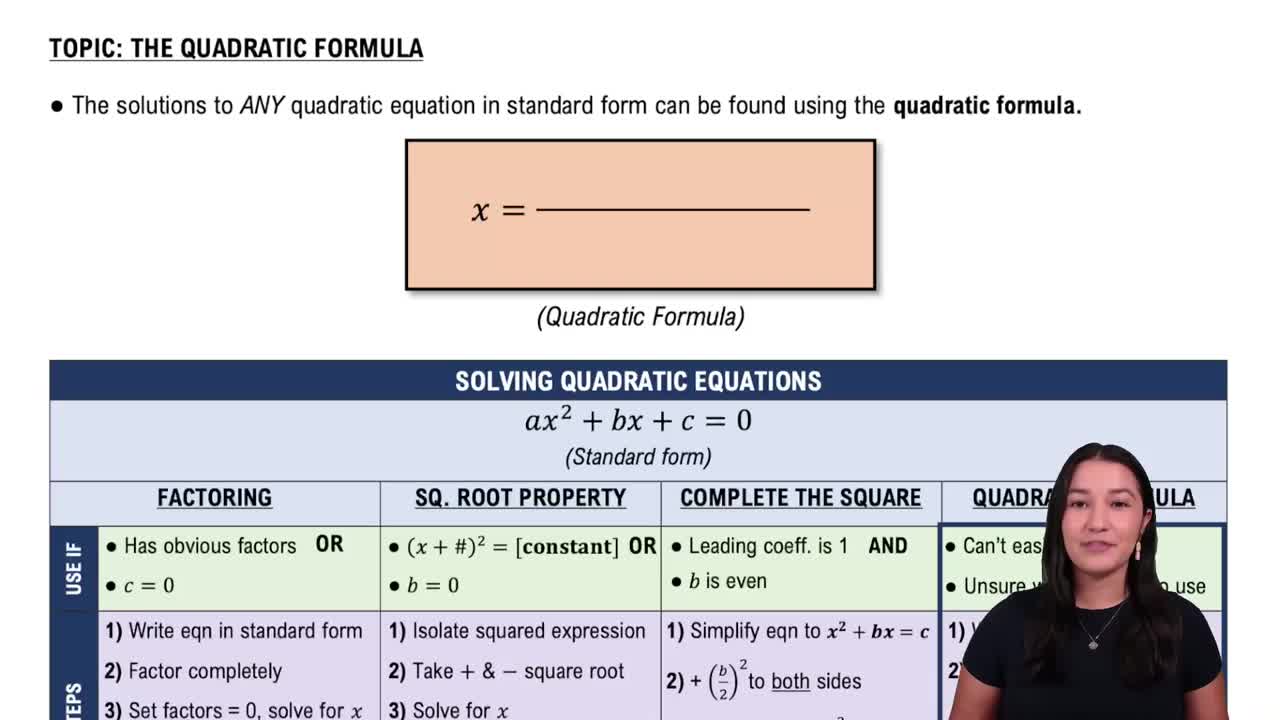
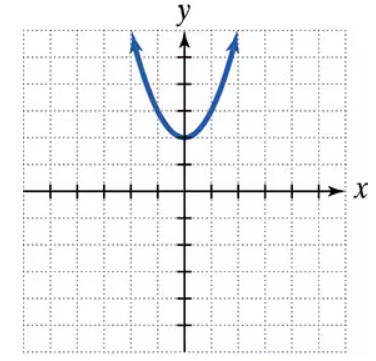
Use the graph to a. determine the x-intercepts, if any; b. determine the y-intercepts, if any. For each graph, tick marks along the axes represent one unit each.
Verified step by step guidance
1
Step 1: Observe the graph of the quadratic function provided. The graph is a parabola that opens upwards, and the tick marks along the axes represent one unit each.
Step 2: To determine the x-intercepts, locate the points where the graph crosses the x-axis. These are the points where the y-value is zero. From the graph, identify the x-coordinates of these points.
Step 3: To determine the y-intercept, locate the point where the graph crosses the y-axis. This is the point where the x-value is zero. From the graph, identify the y-coordinate of this point.
Step 4: Verify the intercepts by checking the coordinates visually on the graph. Ensure that the x-intercepts and y-intercept align with the tick marks provided.
Step 5: Summarize the intercepts: The x-intercepts are the points where the graph crosses the x-axis, and the y-intercept is the point where the graph crosses the y-axis.
Verified video answer for a similar problem:
This video solution was recommended by our tutors as helpful for the problem above
Video duration:
1m
Play a video:
0 Comments
Key Concepts
Here are the essential concepts you must grasp in order to answer the question correctly.
X-Intercepts
X-intercepts are the points where a graph crosses the x-axis. At these points, the value of y is zero. To find the x-intercepts of a function, you set the function equal to zero and solve for x. In the context of a quadratic function, this often involves factoring or using the quadratic formula.
Y-intercepts are the points where a graph crosses the y-axis. At these points, the value of x is zero. To determine the y-intercept of a function, you evaluate the function at x = 0. For quadratic functions, this is simply the constant term when the function is expressed in standard form.
Quadratic functions are polynomial functions of degree two, typically expressed in the form f(x) = ax² + bx + c, where a, b, and c are constants. The graph of a quadratic function is a parabola, which can open upwards or downwards depending on the sign of the coefficient 'a'. Understanding the shape and properties of parabolas is essential for analyzing their intercepts.

 Verified step by step guidance
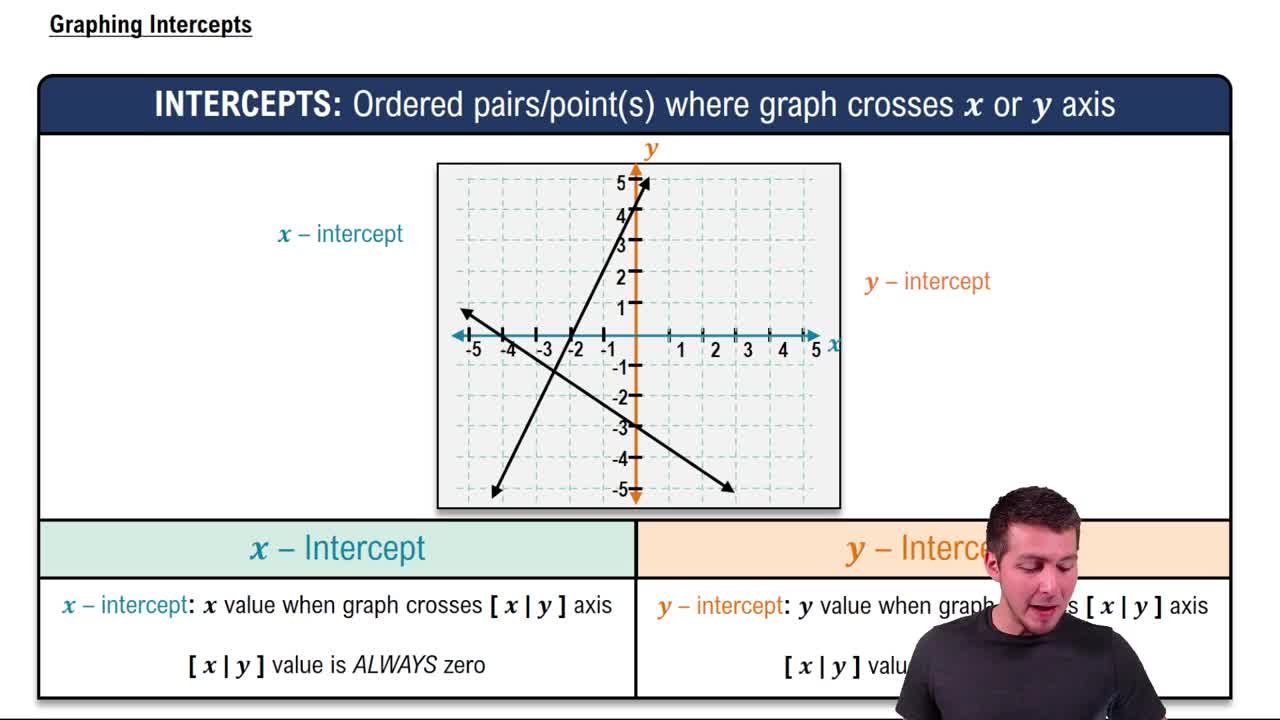
 04:08
04:08