Graph the solution set of each system of inequalities. 3x + 5y ≤ 15 x2 + y2 < 9
Verified step by step guidance
1
Step 1: Identify the inequalities in the system. The first inequality is \(4y - 6x \leq 15\) and the second inequality is \(x^{2} + y^{2} < 16\).
Step 2: Rewrite the first inequality in slope-intercept form to better understand the boundary line. Solve for \(y\):
\(4y \leq 6x + 15\)
\(y \leq \frac{6}{4}x + \frac{15}{4}\)
which simplifies to
\(y \leq \frac{3}{2}x + \frac{15}{4}\).
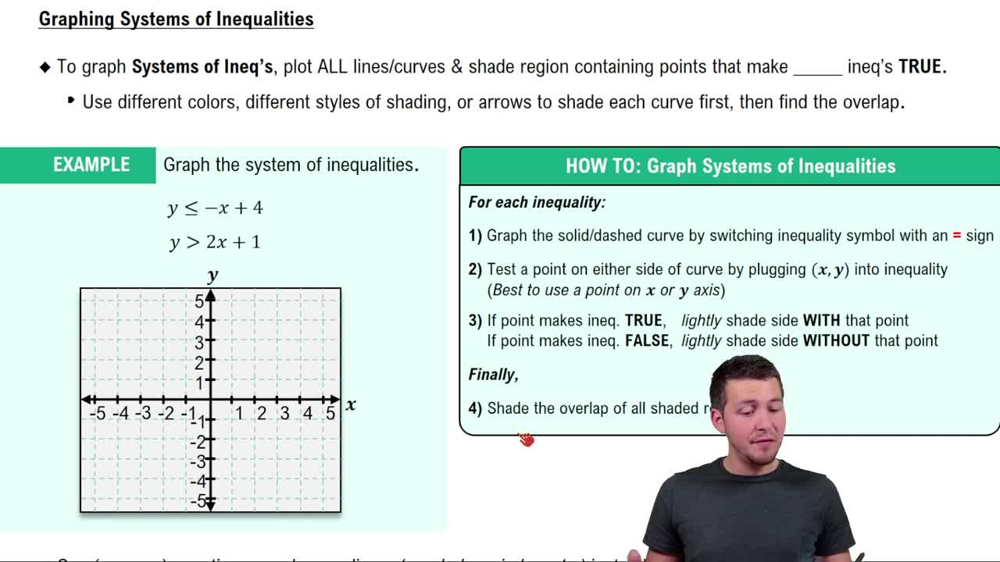
Step 3: Graph the boundary line \(y = \frac{3}{2}x + \frac{15}{4}\). Since the inequality is \(\leq\), the boundary line is solid, indicating points on the line satisfy the inequality. Shade the region below this line because \(y\) is less than or equal to the expression.
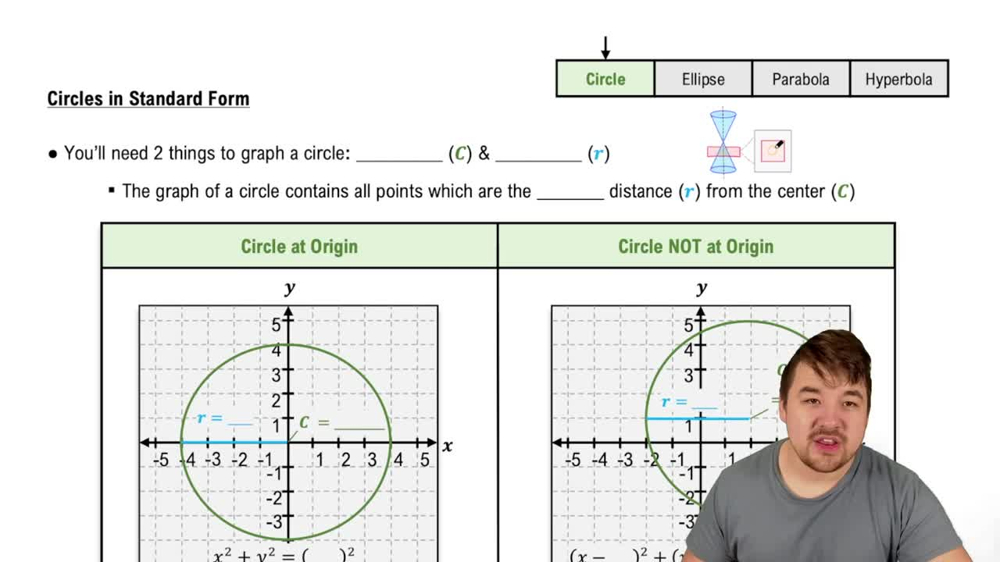
Step 4: For the second inequality \(x^{2} + y^{2} < 16\), recognize this as the interior of a circle centered at the origin \((0,0)\) with radius \$4\( (since \(\sqrt{16} = 4\)). The inequality is strict (\)<$), so the boundary circle is dashed, and the solution includes all points inside the circle but not on the circle.
Step 5: The solution set to the system is the intersection of the two regions: the area inside the circle \(x^{2} + y^{2} < 16\) and the area below or on the line \(y \leq \frac{3}{2}x + \frac{15}{4}\). Graph both and shade the overlapping region to represent the solution set.
Verified video answer for a similar problem:
This video solution was recommended by our tutors as helpful for the problem above
Video duration:
12m
Play a video:
0 Comments
Key Concepts
Here are the essential concepts you must grasp in order to answer the question correctly.
Graphing Linear Inequalities
A linear inequality like 4y - 6x ≤ 15 represents a half-plane on the coordinate plane. To graph it, first rewrite the inequality in slope-intercept form (y ≤ mx + b), then graph the boundary line (solid for ≤ or ≥) and shade the region that satisfies the inequality.
The inequality x² + y² < 16 describes the interior of a circle centered at the origin with radius 4. The boundary circle x² + y² = 16 is not included (dashed line), and the solution set includes all points inside the circle.
The solution set for a system of inequalities is the intersection of the regions satisfying each inequality. Graphically, it is the overlapping shaded area that meets all conditions simultaneously.

 Verified step by step guidance
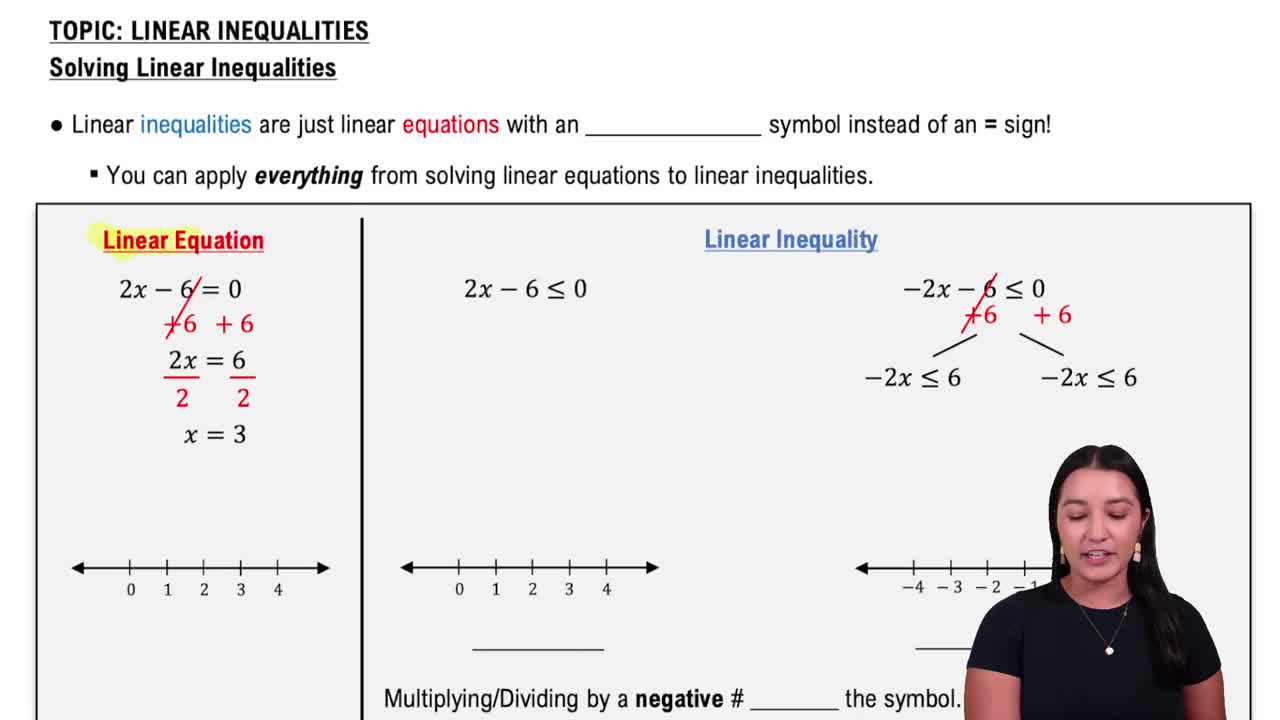
 06:07
06:07