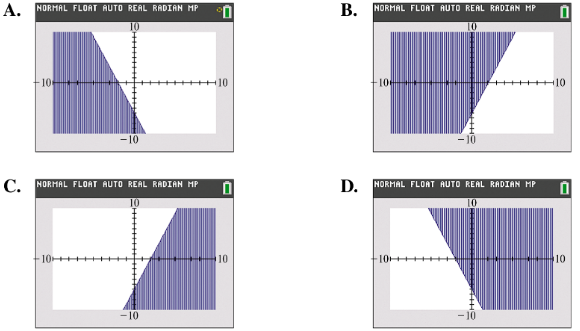
Match each inequality with the appropriate calculator graph in A–D. Do not use a calculator y ≤ -3x - 6
Verified step by step guidance
1
Identify the inequality given: \(y \leq -3x - 6\). This represents all points on or below the line \(y = -3x - 6\).
Rewrite the boundary line equation: \(y = -3x - 6\). This line has a slope of \(-3\) and a y-intercept at \(-6\).
Determine the shading region for the inequality \(y \leq -3x - 6\). Since it is \(\leq\), the solution includes the line and the area below it.
On each graph option (A–D), look for the line with slope \(-3\) and y-intercept \(-6\), then check which graph shades the region below this line.
Match the inequality \(y \leq -3x - 6\) to the graph that shows the line \(y = -3x - 6\) with shading below or on the line.
Verified video answer for a similar problem:
This video solution was recommended by our tutors as helpful for the problem above
Video duration:
5m
Play a video:
0 Comments
Key Concepts
Here are the essential concepts you must grasp in order to answer the question correctly.
Graphing Linear Inequalities
Graphing a linear inequality involves first graphing the related linear equation as a boundary line. The inequality symbol determines whether the boundary is solid (≤ or ≥) or dashed (< or >). The solution region is the half-plane where the inequality holds true, shaded accordingly.
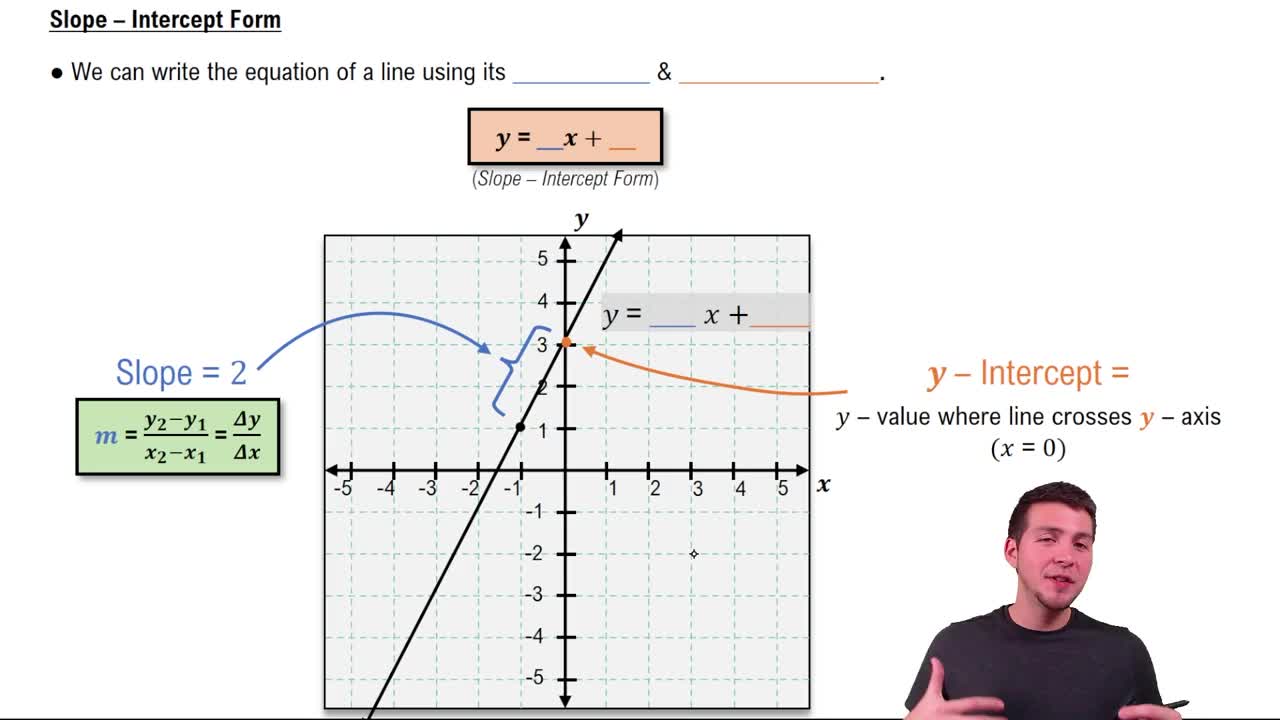
The slope-intercept form y = mx + b expresses a line with slope m and y-intercept b. For y ≤ -3x - 6, the slope is -3, indicating the line falls steeply, and the y-intercept is -6, where the line crosses the y-axis. This form helps quickly sketch the boundary line.
To identify which side of the boundary line to shade, select a test point not on the line (often (0,0)) and substitute into the inequality. If the inequality is true, shade the region containing that point; if false, shade the opposite side. This confirms the correct solution region.

 Verified step by step guidance
 06:07
06:07