Here are the essential concepts you must grasp in order to answer the question correctly.
Linear Equations
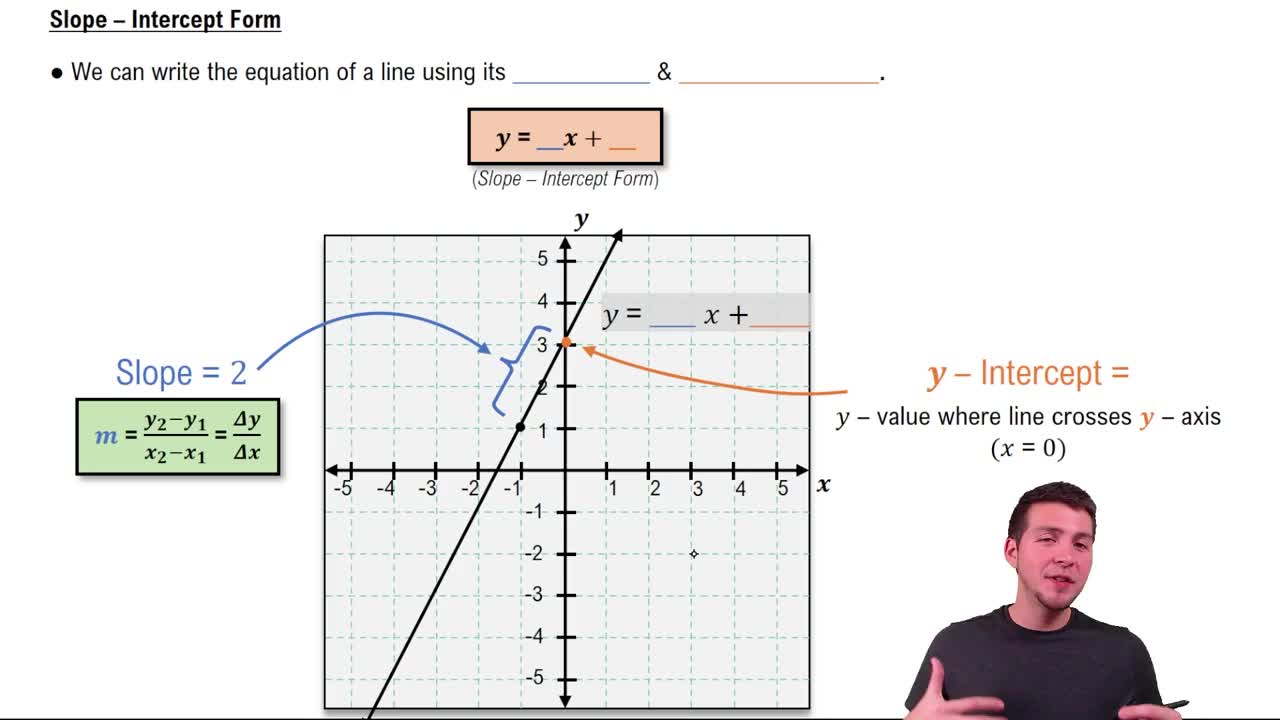
A linear equation is an algebraic expression that represents a straight line when graphed on a coordinate plane. It typically takes the form y = mx + b, where m is the slope and b is the y-intercept. Understanding linear equations is essential for graphing, as it allows students to identify how changes in x affect y.
Recommended video:
Categorizing Linear Equations
Slope and Y-Intercept
The slope of a linear equation indicates the steepness and direction of the line, calculated as the change in y over the change in x (rise/run). The y-intercept is the point where the line crosses the y-axis, representing the value of y when x is zero. In the equation y = 2x - 2, the slope is 2 and the y-intercept is -2, which are crucial for accurately plotting the graph.
Recommended video:
Graphing Points
Graphing points involves plotting specific (x, y) coordinates on a Cartesian plane. For the equation y = 2x - 2, students will substitute the given x-values (-3, -2, -1, 0, 1, 2, 3) to find corresponding y-values. This process helps visualize the relationship between x and y, forming the linear graph of the equation.
Recommended video:
Graphing Equations of Two Variables by Plotting Points