In Exercises 59-66, a. Rewrite the given equation in slope-intercept form. b. Give the slope and y-intercept. c. Use the slope and y-intercept to graph the linear function. 4x+y-6=0
Table of contents
- 0. Review of Algebra4h 18m
- 1. Equations & Inequalities3h 18m
- 2. Graphs of Equations1h 43m
- 3. Functions2h 17m
- 4. Polynomial Functions1h 44m
- 5. Rational Functions1h 23m
- 6. Exponential & Logarithmic Functions2h 28m
- 7. Systems of Equations & Matrices4h 5m
- 8. Conic Sections2h 23m
- 9. Sequences, Series, & Induction1h 22m
- 10. Combinatorics & Probability1h 45m
2. Graphs of Equations
Lines
Problem 68
Textbook Question
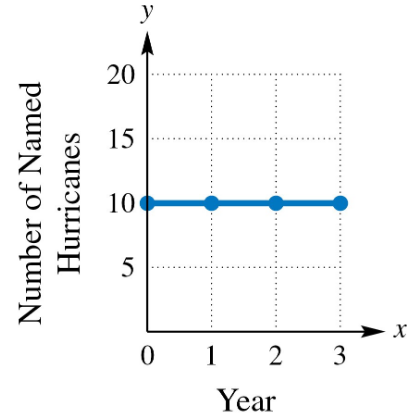
Find and interpret the average rate of change illustrated in each graph.

 Verified step by step guidance
1
Identify two points on the graph to calculate the average rate of change. For example, use the points (0, 135) and (8, 135).
Recall the formula for the average rate of change between two points \((x_1, y_1)\) and \((x_2, y_2)\):
\[\text{Average Rate of Change} = \frac{y_2 - y_1}{x_2 - x_1}\]
Substitute the coordinates of the chosen points into the formula:
\[\frac{135 - 135}{8 - 0}\]
Simplify the numerator and denominator separately to find the average rate of change:
\[\frac{0}{8}\]
Interpret the result: since the average rate of change is zero, this means the function's value does not change as \(x\) changes, indicating a constant function represented by a horizontal line.
 Verified video answer for a similar problem:
This video solution was recommended by our tutors as helpful for the problem above
Video duration:
3mPlay a video:
Key Concepts
Here are the essential concepts you must grasp in order to answer the question correctly.
Average Rate of Change
The average rate of change of a function over an interval measures how much the function's output changes per unit change in input. It is calculated as the change in the y-values divided by the change in the x-values between two points on the graph.
Recommended video:

Change of Base Property
Interpreting Horizontal Lines
A horizontal line on a graph indicates that the function's output remains constant regardless of changes in the input. This means the average rate of change is zero, as there is no increase or decrease in the y-values over the interval.
Recommended video:
Guided course

The Slope of a Line
Slope of a Line
The slope of a line represents the rate at which y changes with respect to x. For a horizontal line, the slope is zero, indicating no change in y-values. Understanding slope helps interpret the average rate of change visually and numerically.
Recommended video:
Guided course

The Slope of a Line
Related Videos
Related Practice
Textbook Question
938
views


