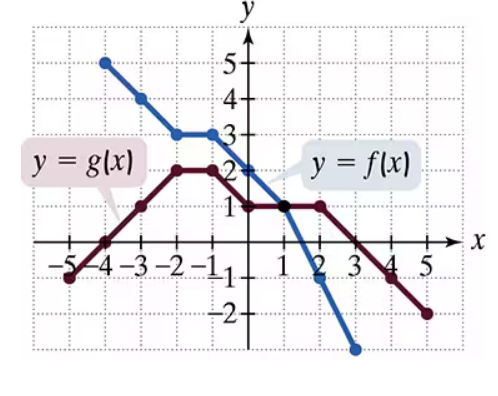
Use the graphs of f and g to solve Exercises 83–90. Find the domain of ƒ/g.
Verified step by step guidance
1
Step 1: Understand the problem. The domain of ƒ/g refers to the set of x-values for which the function ƒ/g(x) is defined. This requires both ƒ(x) and g(x) to be defined, and g(x) must not be equal to zero (since division by zero is undefined).
Step 2: Analyze the graph of g(x). Identify the x-values where g(x) equals zero, as these values must be excluded from the domain of ƒ/g. Look for points on the red graph where the y-coordinate is zero.
Step 3: Determine the domain of ƒ(x). Check the blue graph to identify the x-values where ƒ(x) is defined. These x-values will contribute to the domain of ƒ/g.
Step 4: Combine the results. The domain of ƒ/g will be the intersection of the domain of ƒ(x) and g(x), excluding any x-values where g(x) equals zero.
Step 5: Write the final domain. Based on the graph, list the x-values or intervals that satisfy the conditions for ƒ/g to be defined.
Verified video answer for a similar problem:
This video solution was recommended by our tutors as helpful for the problem above
Video duration:
3m
Play a video:
0 Comments
Key Concepts
Here are the essential concepts you must grasp in order to answer the question correctly.
Domain of a Function
The domain of a function is the set of all possible input values (x-values) for which the function is defined. For rational functions, like ƒ/g, the domain excludes any values that make the denominator zero, as division by zero is undefined. Understanding the domain is crucial for determining where the function can be evaluated.
A rational function is a function that can be expressed as the ratio of two polynomials. In the case of ƒ/g, it is important to analyze both the numerator (f) and the denominator (g) to identify any restrictions on the domain. The behavior of these functions can vary significantly based on their graphs, particularly at points where the denominator approaches zero.
Interpreting graphs of functions is essential for understanding their behavior visually. The graphs of f and g provide insights into their values at specific points, including where g(x) equals zero, which directly affects the domain of the rational function ƒ/g. Analyzing the graphs helps identify critical points and intervals where the function is defined.

 Verified step by step guidance
 3:51
3:51