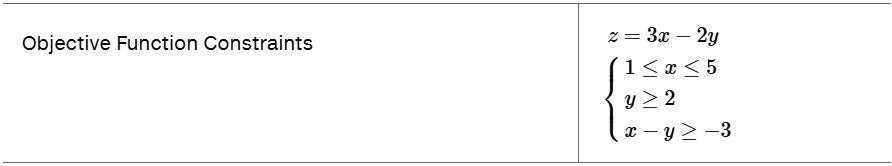
Here are the essential concepts you must grasp in order to answer the question correctly.
Graphing Linear Inequalities
Graphing linear inequalities involves representing the solutions of an inequality on a coordinate plane. Each inequality corresponds to a region on the graph, which is determined by the boundary line. The area above or below the line, depending on the inequality sign, indicates where the solutions lie. Understanding how to graph these inequalities is crucial for visualizing the feasible region in optimization problems.
Recommended video:
Objective Function
An objective function is a mathematical expression that defines the goal of an optimization problem, typically to maximize or minimize a certain quantity. In this context, the objective function is represented as 'z = 5x - y', where 'z' depends on the variables 'x' and 'y'. Evaluating this function at the vertices of the feasible region allows us to determine the optimal solution that meets the constraints.
Recommended video:
Permutations of Non-Distinct Objects
Feasible Region and Corner Points
The feasible region is the area on the graph where all constraints of the inequalities are satisfied simultaneously. The corner points, or vertices, of this region are critical because, according to the Fundamental Theorem of Linear Programming, the maximum or minimum value of the objective function occurs at one of these points. Identifying and evaluating these corner points is essential for solving the optimization problem effectively.
Recommended video: