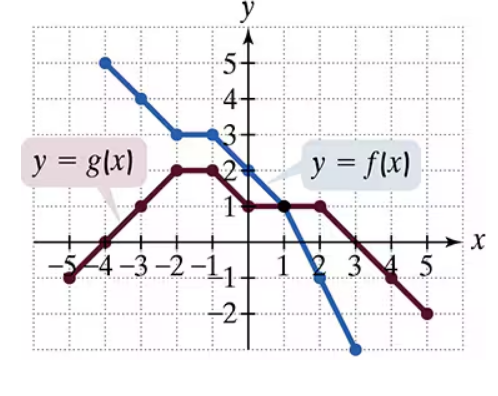
Use the graphs of f and g to solve Exercises 83–90. Graph f-g.
Verified step by step guidance
1
Step 1: Understand the problem. You are tasked with graphing the function f(x) - g(x), which represents the difference between the y-values of f(x) (blue graph) and g(x) (orange graph) at each x-coordinate.
Step 2: Identify key x-values where both f(x) and g(x) are defined. These include x = -6, -4, -2, 0, 2, 4, 6, and 8. For each x-value, note the corresponding y-values of f(x) and g(x).
Step 3: Calculate f(x) - g(x) for each x-value. Subtract the y-value of g(x) from the y-value of f(x) at each x-coordinate. For example, at x = -6, f(x) = 6 and g(x) = -6, so f(x) - g(x) = 6 - (-6) = 12.
Step 4: Plot the points (x, f(x) - g(x)) on the graph. For example, at x = -6, the point would be (-6, 12). Repeat this for all x-values.
Step 5: Connect the plotted points to form the graph of f(x) - g(x). Ensure the graph reflects the calculated differences and follows the general shape dictated by the subtraction of the two functions.
Verified video answer for a similar problem:
This video solution was recommended by our tutors as helpful for the problem above
Video duration:
9m
Play a video:
0 Comments
Key Concepts
Here are the essential concepts you must grasp in order to answer the question correctly.
Function Subtraction
Function subtraction involves taking two functions, f(x) and g(x), and creating a new function h(x) = f(x) - g(x). This new function represents the vertical distance between the graphs of f and g at any given x-value. Understanding how to perform this operation is essential for graphing the resulting function.
Graphing functions requires plotting points on a coordinate plane based on the function's output values for given input values. For the functions f(x) and g(x), one must accurately represent their values on the graph to visualize their behavior. This skill is crucial for understanding how to combine functions through operations like subtraction.
When subtracting one function from another, the resulting graph can be interpreted as a vertical shift of the original functions. The graph of h(x) = f(x) - g(x) will show where f(x) is above or below g(x), indicating the points of intersection and the overall relationship between the two functions. Recognizing these shifts helps in accurately sketching the graph of the resulting function.

 Verified step by step guidance
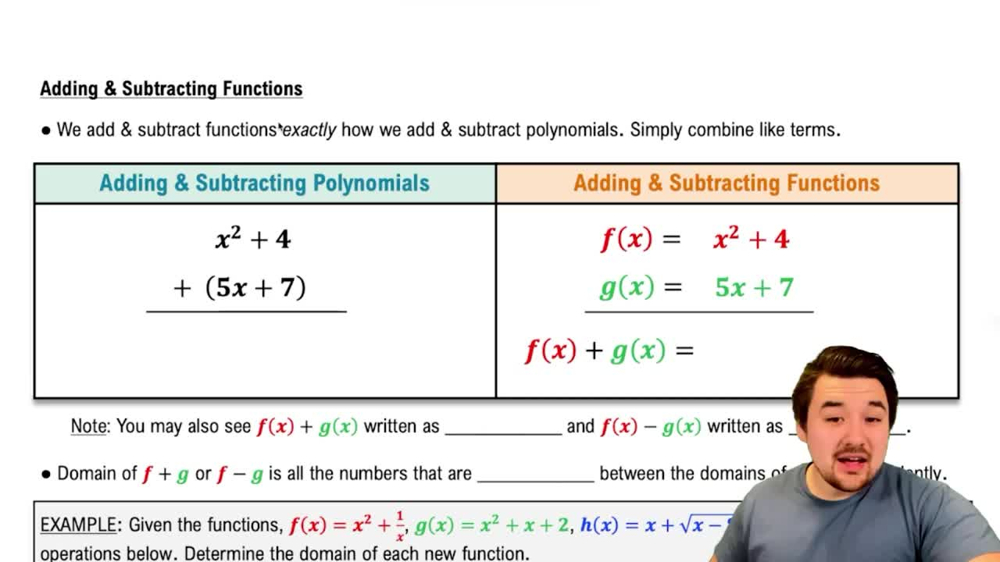
 5:56
5:56