Follow the seven steps to graph each rational function. f(x)=2/(x2+x−2)
Verified step by step guidance
1
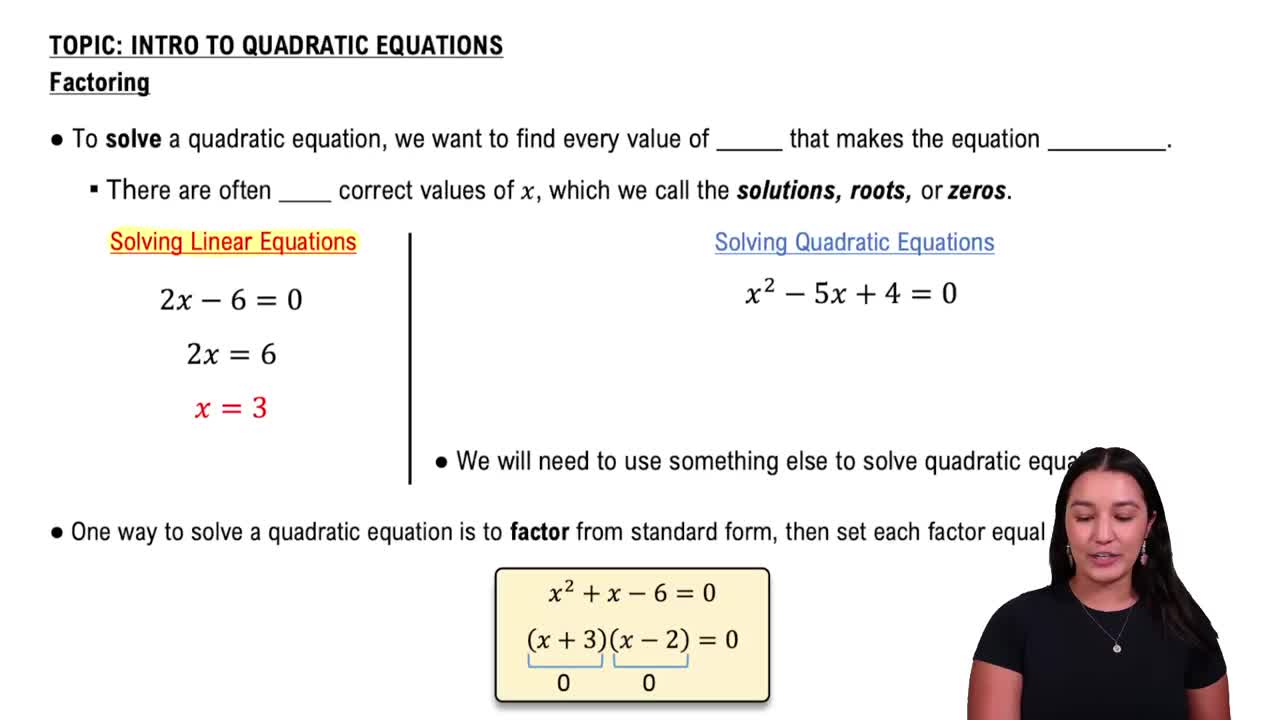
Identify the domain of the function by finding the values of \(x\) that make the denominator zero. Solve the quadratic equation \(x^{2} + x - 2 = 0\) to find these values, since the function is undefined there.
Factor the denominator \(x^{2} + x - 2\) into \((x + 2)(x - 1)\) to clearly see the zeros and potential vertical asymptotes at \(x = -2\) and \(x = 1\).
Determine the vertical asymptotes by setting each factor in the denominator equal to zero: \(x + 2 = 0\) and \(x - 1 = 0\), which gives \(x = -2\) and \(x = 1\) respectively.
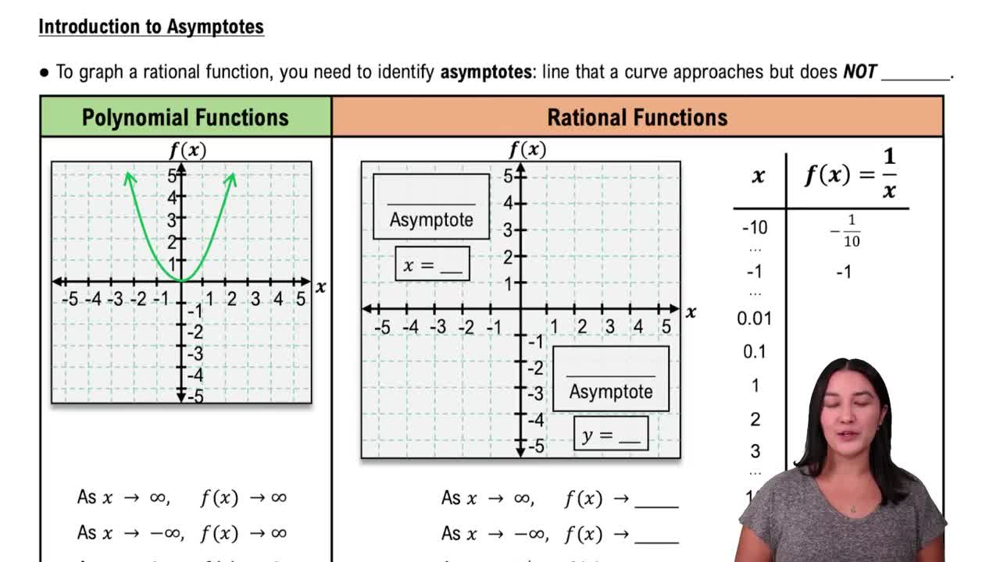
Find the horizontal asymptote by comparing the degrees of the numerator and denominator. Since the numerator is a constant (degree 0) and the denominator is degree 2, the horizontal asymptote is \(y = 0\).
Create a table of values by choosing \(x\)-values around the vertical asymptotes and plugging them into \(f(x) = \frac{2}{x^{2} + x - 2}\) to find corresponding \(y\)-values. This will help in sketching the graph accurately.
Verified video answer for a similar problem:
This video solution was recommended by our tutors as helpful for the problem above
Video duration:
16m
Play a video:
0 Comments
Key Concepts
Here are the essential concepts you must grasp in order to answer the question correctly.
Rational Functions
A rational function is a ratio of two polynomials, expressed as f(x) = P(x)/Q(x). Understanding its domain, zeros, and behavior is essential for graphing. The function is undefined where the denominator Q(x) equals zero, leading to vertical asymptotes or holes.
Factoring the quadratic denominator x² + x − 2 helps identify values that make the denominator zero. By rewriting it as (x + 2)(x − 1), we find critical points where the function is undefined, which correspond to vertical asymptotes or discontinuities in the graph.
Asymptotes are lines that the graph approaches but never touches. Vertical asymptotes occur where the denominator is zero, and horizontal or oblique asymptotes describe end behavior. Identifying these helps sketch the graph accurately and understand the function's limits.

 Verified step by step guidance
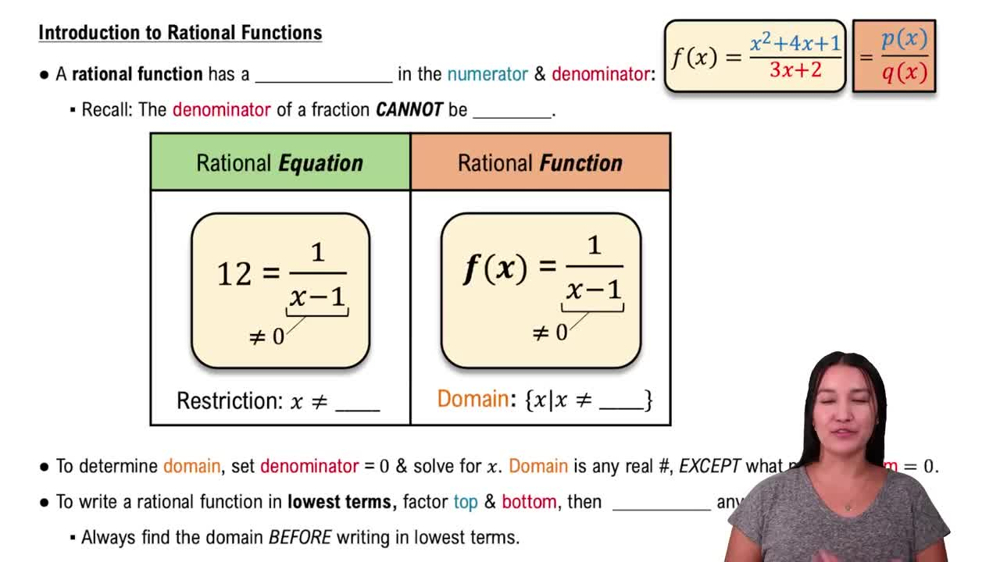
 6:04
6:04