Identify the boundary curve by rewriting the inequality as an equation: \(y = (x - 1)^{2} + 2\). This is a parabola opening upwards with vertex at \((1, 2)\).
Graph the parabola \(y = (x - 1)^{2} + 2\) on the coordinate plane. Since the inequality is strict (\(>\)), draw the parabola as a dashed curve to indicate points on the curve are not included.
Determine which side of the parabola to shade by testing a point not on the curve, such as the point \((1, 3)\). Substitute into the inequality: \$3 > (1 - 1)^{2} + 2\( simplifies to \)3 > 2$, which is true.
Since the test point satisfies the inequality, shade the region above the parabola where \(y\) values are greater than \((x - 1)^{2} + 2\).
Label the graph clearly, showing the dashed parabola and the shaded region above it to represent all solutions to the inequality \(y > (x - 1)^{2} + 2\).
Verified video answer for a similar problem:
This video solution was recommended by our tutors as helpful for the problem above
Video duration:
9m
Play a video:
0 Comments
Key Concepts
Here are the essential concepts you must grasp in order to answer the question correctly.
Graphing Quadratic Functions
A quadratic function is represented by an equation of the form y = ax² + bx + c, producing a parabola when graphed. Understanding the shape and vertex of the parabola y = (x - 1)² + 2 helps in visualizing the boundary curve for the inequality.
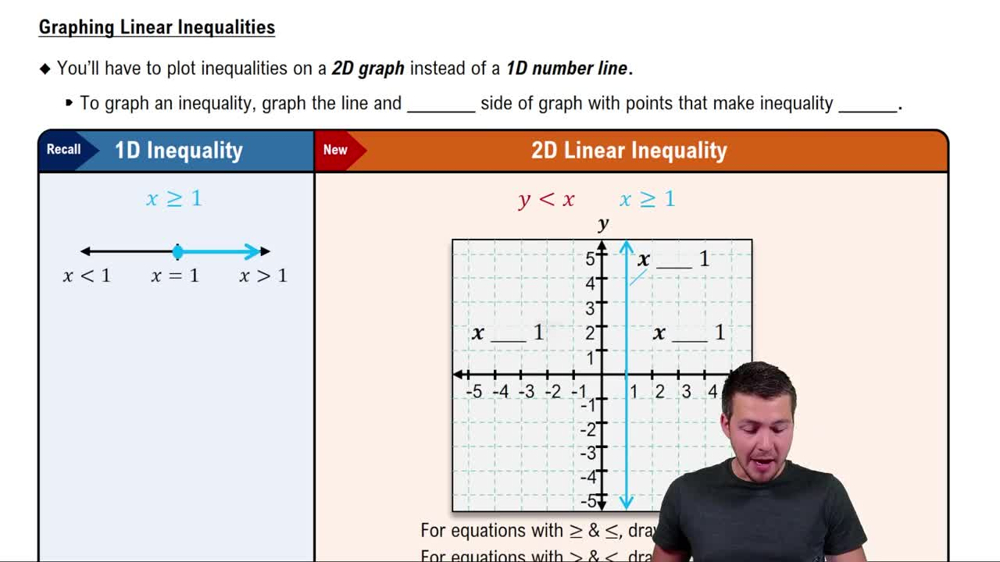
Graphing inequalities involves shading the region of the coordinate plane where the inequality holds true. For y > (x - 1)² + 2, the area above the parabola is shaded, indicating all points where y-values are greater than the quadratic expression.
The boundary of the inequality y > (x - 1)² + 2 is the parabola y = (x - 1)² + 2. Since the inequality is strict (greater than, not greater than or equal to), the boundary curve is drawn as a dashed line to show points on the curve are not included in the solution.

 Verified step by step guidance
 5:26
5:26