 Back
BackCollege Algebra Essentials: Functions, Equations, and Notation
Study Guide - Smart Notes
 Tailored notes based on your materials, expanded with key definitions, examples, and context.
Introduction to College Algebra
College Algebra provides foundational mathematical tools for modeling and understanding relationships between variables. The course emphasizes visualizing mathematics through graphs, developing conceptual understanding of functions, rates of change, and patterns. Mastery of algebra strengthens logical reasoning, critical thinking, and analytical skills, preparing students for advanced studies and real-world applications.
Functions and Their Graphs
Definition of a Function
A function is a relation that assigns each input (from the domain) exactly one output (in the range). Functions are often represented as equations, tables, or graphs.
Domain: The set of all possible input values (x-values).
Range: The set of all possible output values (y-values).
Graphical Representation: Functions can be visualized on a coordinate plane, showing how y changes with x.
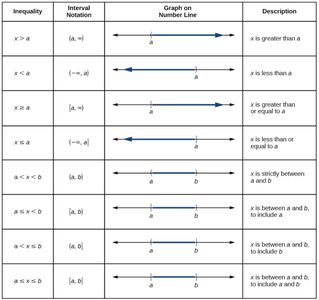
Interval Notation and Inequalities
Interval notation is used to describe sets of numbers, especially solutions to inequalities. It provides a concise way to express ranges of values.
Open Interval: means all values between a and b, not including a or b.
Closed Interval: means all values between a and b, including both endpoints.
Half-Open Interval: or includes one endpoint.
Infinite Intervals: or represent all values less than or greater than a.
Below is a reference table summarizing common inequalities, their interval notation, graphical representation, and descriptions:
Linear Functions and Their Graphs
Key Formulas for Linear Functions
Linear functions describe relationships with constant rates of change. The most common forms are:
Slope Formula:
Point-Slope Formula:
Slope-Intercept Formula:
Average Rate of Change:
These formulas are used to model and analyze linear relationships in various contexts, such as business, science, and everyday life.
Transformations of Functions
Types of Transformations
Transformations alter the appearance of a function's graph without changing its fundamental nature. Common transformations include:
Vertical Translation: (shifts graph up or down)
Horizontal Translation: (shifts graph left or right)
Reflection in x-axis:
Reflection in y-axis:
Vertical Stretch/Shrink:
Horizontal Stretch/Shrink:
Quadratic Functions and Equations
Standard and Vertex Forms
Quadratic functions model parabolic relationships and are fundamental in algebra. The standard and vertex forms are:
Standard Form:
Vertex Form:
The vertex represents the maximum or minimum point of the parabola.
Quadratic Formula
To solve quadratic equations:
Quadratic Formula:
This formula finds the roots (solutions) of any quadratic equation.
Rational Functions
Definition and Properties
A rational function is a ratio of two polynomials: , where and have no common factors.
Vertical Asymptote: zeros of
Horizontal Asymptote:
If , (lead coefficients)
If ,
If , no horizontal asymptote
Oblique (Slant) Asymptote: If is exactly 1 more than , quotient
Exponential and Logarithmic Functions
Exponential Functions
Compound Interest (Periodic):
Exponential Growth:
Compound Interest (Continuous):
Exponential Decay:
Doubling/Half-Life:
Logarithmic Functions
Change of Base:
Definition:
Product Property:
Power Property:
Quotient Property:
Variation
Types of Variation
Direct Variation:
Inverse Variation: or
Joint Variation:
Common Application Formulas
Perimeter of a Rectangle:
Area of a Rectangle:
Simple Interest:
Distance:
Pythagorean Theorem:
Additional info: These notes are structured to cover the main topics outlined in the course syllabus, including functions, equations, transformations, and applications. The interval notation table is included as it directly supports understanding inequalities and their graphical representation.
