 Back
BackCollege Algebra Exam I – Step-by-Step Study Guidance
Study Guide - Smart Notes
 Tailored notes based on your materials, expanded with key definitions, examples, and context.
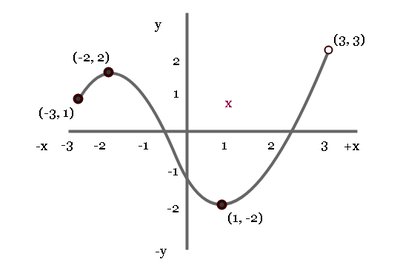
Q1. Determine the domain and range of the functions and express it in interval notation and inequality.
Background
Topic: Domain and Range of Functions
This question tests your understanding of how to find the set of all possible input values (domain) and output values (range) for a given function, and how to express these sets using interval notation and inequalities.
Key Terms:
Domain: The set of all possible input values (x-values) for which the function is defined.
Range: The set of all possible output values (y-values) the function can take.
Interval Notation: A way of describing sets of numbers using intervals (e.g., ).
Inequality: A mathematical statement that relates expressions using symbols like , , , .
Step-by-Step Guidance
Examine the graph or formula of the function to determine for which x-values the function is defined (domain).
Look for any restrictions, such as holes, endpoints, or asymptotes, that might limit the domain.
Identify the lowest and highest y-values the function attains (range), considering the graph or formula.
Express the domain and range both in interval notation and as inequalities.
Try solving on your own before revealing the answer!
Q2. A company produces and sells a wireless doorbell with revenue given by and cost given by , where is the number of wireless speakers produced and sold.
Background
Topic: Break-Even Analysis (Linear Functions)
This question tests your ability to set up and solve equations involving revenue and cost functions to find the break-even point, interpret the meaning of the break-even y-coordinate, and graph linear functions.
Key Terms and Formulas:
Revenue Function (): The total income from sales, as a function of the number of units sold.
Cost Function (): The total cost of producing units.
Break-Even Point: The value of where .
Step-by-Step Guidance
Set the revenue function equal to the cost function: .
Solve for to find the number of units at break-even.
To find the y-coordinate, substitute the break-even value into either or .
Interpret the y-coordinate: What does this value represent in the context of the problem?
To graph, plot both and on the same axes, label each line, and mark the intersection point (break-even).
Try solving on your own before revealing the answer!
Q3. For the function :
Background
Topic: Quadratic Functions – Domain, Range, and Graphing
This question tests your ability to determine the domain of a quadratic function, evaluate the function at given points, and plot the graph using a table of values.
Key Terms and Formulas:
Quadratic Function: A function of the form .
Domain: For most quadratics, all real numbers ().
Table of Values: A list of values and their corresponding values.
Step-by-Step Guidance
State the domain of (consider if there are any restrictions on ).
For each value in the table, substitute into and compute the result.
Fill in the table with the calculated values.
Plot the points on the provided graph.
Try solving on your own before revealing the answer!
Q4. The table below gives the percent of U.S. residents who reported smoking for selected years. Find the model that gives , smoking of residents, in percent, as a function of , the number of years after 1985. Round your model to three decimal places.
Background
Topic: Linear Regression/Modeling from Data
This question tests your ability to create a linear model from a data set, interpret the slope, and use the model for prediction.
Key Terms and Formulas:
Linear Model: , where is the slope and is the y-intercept.
Slope (): The rate of change of with respect to .
Prediction: Substitute a value for into the model to estimate .
Step-by-Step Guidance
Convert each year to (years after 1985).
Use two points to calculate the slope using .
Find the y-intercept by substituting one point into .
Write the linear model (rounded to three decimal places).
Interpret the slope in the context of the problem.
Substitute into your model to estimate the percent for 2025.
Try solving on your own before revealing the answer!
Q5. A company has determined that its profit for a product can be described by a linear function. The profit from production and sale of 232 units is $321, and the profit from 264 units is $545.
Background
Topic: Linear Functions – Finding Equations from Two Points
This question tests your ability to find the equation of a linear function given two points, interpret the rate of change, and solve for when profit is zero (break-even).
Key Terms and Formulas:
Linear Function:
Slope ():
Break-even: Set and solve for .
Step-by-Step Guidance
Label the two points: and .
Calculate the slope using the two points.
Substitute one point and the slope into to solve for .
Write the profit function .
Set and solve for to find the minimum units for no loss.
Try solving on your own before revealing the answer!
Q6. Given the inequality , solve the inequality for .
Background
Topic: Solving Linear Inequalities
This question tests your ability to manipulate and solve inequalities involving fractions and variables on both sides.
Key Terms and Formulas:
Linear Inequality: An inequality involving a linear expression.
Properties of Inequalities: You can add, subtract, multiply, or divide both sides by the same value (except when multiplying/dividing by a negative, which reverses the inequality).
Step-by-Step Guidance
Distribute to both terms inside the parentheses.
Combine like terms and move all terms to one side and constants to the other.
Solve for , remembering to reverse the inequality if you multiply or divide by a negative.
Try solving on your own before revealing the answer!
Q7. Find algebraically the difference quotient where for the function and simplify.
Background
Topic: Difference Quotient (Foundations of Calculus)
This question tests your ability to compute and simplify the difference quotient for a given function, which is foundational for understanding derivatives.
Key Terms and Formulas:
Difference Quotient:
Function Substitution: Replace with in to find .
Step-by-Step Guidance
Find by substituting into the function.
Compute .
Simplify the numerator as much as possible.
Divide the simplified numerator by .
Try solving on your own before revealing the answer!
Q8. Solve the system of linear equations by ELIMINATION method: and .
Background
Topic: Systems of Linear Equations – Elimination Method
This question tests your ability to solve a system of two linear equations using the elimination method, which involves adding or subtracting equations to eliminate one variable.
Key Terms and Formulas:
Elimination Method: Manipulate equations so that adding or subtracting them eliminates one variable.
System of Equations: Two or more equations with the same variables.
Step-by-Step Guidance
Rewrite both equations in standard form ().
Multiply one or both equations (if needed) so the coefficients of one variable are opposites.
Add or subtract the equations to eliminate one variable.
Solve for the remaining variable.
Substitute back to find the other variable.
Try solving on your own before revealing the answer!
Bonus Question: Write the equation of the line with the given condition:
a. Vertical line, passing through the point (5, -7).
b. Horizontal line, passing through the point (9, 15).
Background
Topic: Equations of Vertical and Horizontal Lines
This question tests your understanding of how to write equations for lines that are either vertical or horizontal, given a point they pass through.
Key Terms and Formulas:
Vertical Line: Equation is for some constant .
Horizontal Line: Equation is for some constant .
Step-by-Step Guidance
For a vertical line through , the equation is .
For a horizontal line through , the equation is .
Try solving on your own before revealing the answer!
