 Back
BackCollege Algebra Final Exam Review – Step-by-Step Guidance
Study Guide - Smart Notes
 Tailored notes based on your materials, expanded with key definitions, examples, and context.
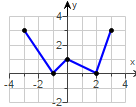
Q23. Determine whether the graph is that of a function by using the vertical-line test. If it is, use the graph to find:
(a) Is the graph a function?
(b) The domain and range
(c) The intercepts, if any
(d) Any symmetry with respect to the x-axis, the y-axis, or the origin
Background
Topic: Functions and Graphs
This question tests your understanding of how to determine if a graph represents a function (using the vertical-line test), and how to extract key properties such as domain, range, intercepts, and symmetry from a graph.
Key Terms and Concepts:
Vertical-Line Test: A graph represents a function if and only if no vertical line intersects the graph at more than one point.
Domain: The set of all possible input values (x-values) for the function.
Range: The set of all possible output values (y-values) for the function.
Intercepts: Points where the graph crosses the x-axis (x-intercepts) and y-axis (y-intercepts).
Symmetry: A graph can be symmetric with respect to the x-axis, y-axis, or origin.
Step-by-Step Guidance
Examine the graph and apply the vertical-line test: Imagine drawing vertical lines at various x-values. Does any vertical line cross the graph more than once?
Identify the domain: Look at the leftmost and rightmost x-values where the graph exists. List all x-values for which the graph is defined.
Identify the range: Observe the lowest and highest y-values the graph attains. List all y-values that the graph reaches.
Find the intercepts: Look for points where the graph crosses the x-axis (set y = 0) and the y-axis (set x = 0).
Check for symmetry: Fold the graph along the x-axis, y-axis, and origin. Does the graph match itself in any of these cases?
Try solving on your own before revealing the answer!
Final Answer:
(a) Yes, the graph passes the vertical-line test, so it is a function.
(b) Domain: ; Range:
(c) Intercepts: x-intercepts at and ; y-intercept at
(d) The graph is symmetric with respect to the y-axis (even function).
The vertical-line test confirms the graph is a function, and the symmetry about the y-axis indicates it is even.
