 Back
BackCollege Algebra: Functions and Their Graphs (Sections 1.1–1.3) Study Notes
Study Guide - Smart Notes
 Tailored notes based on your materials, expanded with key definitions, examples, and context.
Functions and Their Graphs
Section 1.1: Functions
This section introduces the foundational concepts of relations and functions, including their definitions, notation, and examples. Understanding these concepts is essential for analyzing mathematical relationships and their graphical representations.
Relation: A relation is a correspondence between two sets: a set X (domain) and a set Y (range). Each element from the domain corresponds to at least one element from the range.
Domain: The set of all possible input values (independent variable) for a relation or function.
Range: The set of all possible output values (dependent variable) for a relation or function.
Function: A function from X into Y is a relation that associates each element of X with exactly one element of Y. In function notation, this is written as .
Function Notation: The notation denotes the value of the function f at input x.
Independent Variable: The variable representing the input of the function (commonly x).
Dependent Variable: The variable representing the output of the function (commonly y), which depends on the value of the independent variable.
Example of a Relation: The pairing of students and their grades. Example of a Function: The relationship between hours spent on physical therapy and improvement in knee flexion.
Determining Functions from Relations
To determine if a relation is a function, check if each input is associated with exactly one output.
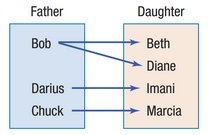
Explanation: In the diagram above, 'Bob' is paired with both 'Beth' and 'Diane', so this relation is not a function because one input (Bob) corresponds to more than one output.
Domain and Range in Set Notation
Example: For the set {(1,3), (2,3), (3,3), (4,3)}, the domain is {1,2,3,4} and the range is {3}. This is a function because each input has only one output.
Example: For the set {(-4,4), (-3,3), (-2,2), (-1,1), (-4,0)}, the domain is {-4,-3,-2,-1} and the range is {4,3,2,1,0}. This is not a function because -4 is paired with both 4 and 0.
Determining Functions from Equations
To determine if an equation defines y as a function of x, solve for y and check if each x yields only one y value.
Examples:
is a function (domain: all real numbers).
is a function (domain: ).
is not a function (a circle fails the vertical line test).
is not a function (each yields two values).
is a function (domain: ).
Evaluating Functions and Function Operations
Given , evaluate:
Difference Quotient
The difference quotient for a function is:
For : Difference quotient:
For : Difference quotient:
Operations with Functions
Given and :
Sum:
Difference:
Product:
Quotient: , domain excludes where
Application Example
Gross wages as a function of hours worked at : Domain: (cannot work negative hours)
Section 1.2: The Graph of a Function
This section focuses on graphical representations of functions, including the vertical line test, intercepts, and symmetry.
Vertical Line Test: A set of points in the -plane is the graph of a function if and only if every vertical line intersects the graph at most once.
Zero: The zeros of a function are the -values where (i.e., the $x$-intercepts).
Using the Vertical Line Test
If any vertical line crosses a graph more than once, the graph does not represent a function.
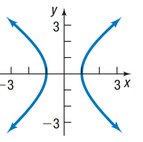
Explanation: The graph above fails the vertical line test, so it does not represent a function.
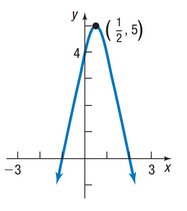
![Graph of a function with domain [0,4]](https://static.studychannel.pearsonprd.tech/study_guide_files/college-algebra/sub_images/21f16efe_image_3.png)
Explanation: The graph above passes the vertical line test and represents a function with domain .
![Graph of a function with domain [-3, infinity]](https://static.studychannel.pearsonprd.tech/study_guide_files/college-algebra/sub_images/21f16efe_image_4.png)
Explanation: The graph above passes the vertical line test and represents a function with domain .
Explanation: The graph above passes the vertical line test and represents a function with domain .
Analyzing Graphs of Functions
To analyze a graph, identify:
Domain and range
- and -intercepts
Symmetry (about -axis, -axis, or origin)
Where the function is positive or negative
Zeros of the function
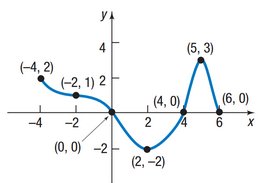
Explanation: The graph above can be used to answer questions about function values, intercepts, and intervals where the function is positive or negative.
Section 1.3: Properties of Functions
This section explores the classification of functions based on their symmetry and behavior, as well as concepts such as maxima, minima, and average rate of change.
Even Function: is even if for all in the domain. The graph is symmetric about the -axis.
Odd Function: is odd if for all in the domain. The graph is symmetric about the origin.
Increasing Function: As increases, increases.
Decreasing Function: As increases, decreases.
Constant Function: As increases, remains unchanged.
Local Maximum: The highest point in a small neighborhood of the graph.
Local Minimum: The lowest point in a small neighborhood of the graph.
Absolute Maximum: The highest value of the function over its entire domain.
Absolute Minimum: The lowest value of the function over its entire domain.
Average Rate of Change: The change in over the change in on an interval :
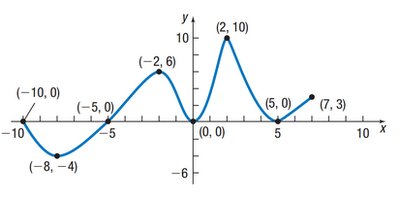
Explanation: The graph above illustrates local maxima, local minima, and absolute extrema.
Even, Odd, or Neither
To determine if a function is even, odd, or neither, substitute for and compare to and .
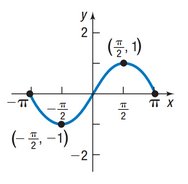
Explanation: The graph above is symmetric about the origin, indicating an odd function.
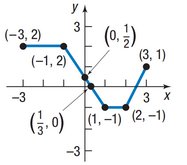
Explanation: The graph above is neither symmetric about the -axis nor the origin, so it is neither even nor odd.
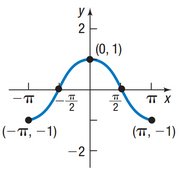
Explanation: The graph above is symmetric about the -axis, indicating an even function.
Average Rate of Change and Secant Lines
For , the average rate of change from to is:
The equation of the secant line through and is: , where is the average rate of change.
Summary Table: Properties of Functions
Property | Definition | Graphical Feature |
|---|---|---|
Even | Symmetric about -axis | |
Odd | Symmetric about origin | |
Increasing | for | Rises left to right |
Decreasing | for | Falls left to right |
Constant | for all | Horizontal line |
Additional info: Some explanations and examples were expanded for clarity and completeness, including step-by-step calculations for function operations and the difference quotient.
