Back
BackCollege Algebra Practice Exam Guidance
Study Guide - Smart Notes
 Tailored notes based on your materials, expanded with key definitions, examples, and context.
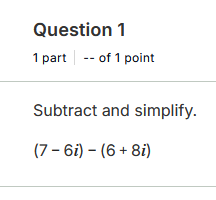
Q1. Subtract and simplify:
Background
Topic: Complex Numbers
This question tests your ability to perform operations (subtraction) with complex numbers and simplify the result.
Key Terms and Formulas:
Complex number: , where is the real part and is the imaginary part.
Subtraction:
Step-by-Step Guidance
Write both complex numbers: and .
Subtract the real parts: .
Subtract the imaginary parts: .
Combine the results to form a new complex number.
Try solving on your own before revealing the answer!
Final Answer:
Subtracting the real and imaginary parts gives $1-14$ for the imaginary part.
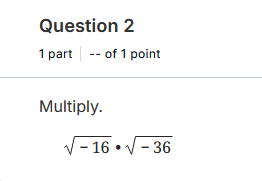
Q2. Multiply:
Background
Topic: Imaginary Numbers and Radical Operations
This question tests your understanding of multiplying square roots of negative numbers, which involves imaginary numbers.
Key Terms and Formulas:
Imaginary unit: , where
for
Multiplication of radicals:
Step-by-Step Guidance
Rewrite as and as .
Calculate and separately.
Multiply the results together, including the terms.
Recall that .
Try solving on your own before revealing the answer!
Final Answer:
Multiplying the values and using gives a real number result.
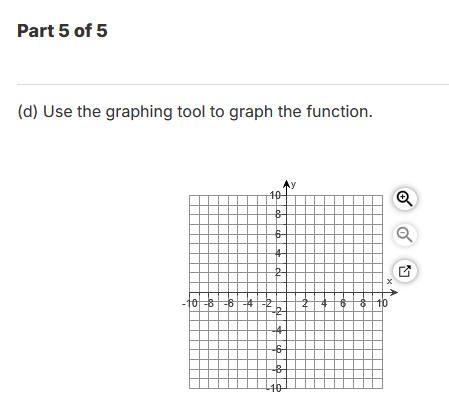
Q3. Use the graphing tool to graph the function.
Background
Topic: Graphing Functions
This question tests your ability to plot a function on a coordinate grid, which is a fundamental skill in college algebra.
Key Terms and Formulas:
Coordinate axes: (horizontal), (vertical)
Graphing: Plotting points that satisfy the function's equation
Step-by-Step Guidance
Identify the function you need to graph (not shown in the image, but typically given in the question).
Determine key points (such as intercepts, vertex, or other relevant features).
Plot these points on the provided grid.
Draw the curve or line that represents the function, connecting the points smoothly.
Try graphing the function on your own before revealing the answer!
Final Answer: Graph of the function (specific function not provided)
The graph should accurately represent the function's behavior based on the points and features you identified.
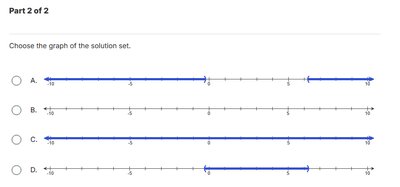
Q4. Choose the graph of the solution set.
Background
Topic: Solution Sets and Interval Notation
This question tests your ability to interpret and select the correct graph that represents a solution set, often related to inequalities or intervals.
Key Terms and Formulas:
Solution set: The set of values that satisfy a given equation or inequality
Interval notation: Describes the range of values included in the solution set
Graphing solution sets: Visual representation on a number line
Step-by-Step Guidance
Read the solution set or inequality (not shown in the image, but typically given in the question).
Determine the interval or set of values included in the solution.
Match the interval to the correct graph option (A, B, C, or D).
Check for open or closed endpoints, arrows, and the range covered.
Try matching the solution set to the correct graph before revealing the answer!
Final Answer: Correct graph option (A, B, C, or D)
The correct graph will visually represent the interval or solution set described in the question.